Btc and Eth 5 min winnerWhat the Strategy Does
Finding the Trend (Like Watching the Bus Move): The strategy uses special tools called Hull Moving Averages (HMAs) to figure out if Bitcoin (BTC) Ethereum (ETH) prices are generally going up or down. It looks at short-term (5 minutes) and long-term (10 minutes) price movements to make sure the “bus” (the market) is moving strongly in one direction—up for buying, down for selling.
Spotting Good Times to Jump On (Buy or Sell Signals): It looks for two types of opportunities:
Pullbacks: When the price dips a little while still moving up (like the bus slowing down but not stopping), it’s a chance to buy.
Breakouts: When the price suddenly jumps higher after being stuck (like the bus speeding up), it’s another chance to buy. It does the opposite for selling when prices are dropping.
It also checks if there’s enough “passenger activity” (volume) and momentum (speed of price change) to make sure it’s a good move.
Avoiding Traffic Jams (Filters): The strategy uses tools like RSI (to check if the market’s too fast or too slow), volume (to see if enough people are trading), and ATR (to measure how wild the price swings are). It skips trades if things look too chaotic or if the trend isn’t strong enough.
Setting Safety Stops and Profit Targets: Once you’re on the “bus,” it sets rules to protect you:
Stop-Loss: If the price moves against you by a small amount (0.5% of the typical price swing), you jump off to avoid losing too much—think of it as getting off before the bus crashes.
Take-Profit: If the price moves in your favor by a small amount (1.0% of the typical swing), you cash out—imagine getting off at your stop with a profit.
Trailing Stop: If the price keeps moving your way, it adjusts your exit point to lock in more profit, like moving your stop closer as the bus keeps going.
Using Leverage (10x Boost): This strategy uses 10x leverage on Binance futures, meaning for every $1 you have, you trade like you have $10. This can make profits (or losses) 10 times bigger, so it’s risky but can be rewarding if you’re careful.
Why 5 Minutes and Bitcoin and Ethereum?
5-Minute Chart: This is like checking the bus every 5 minutes to make quick, small trades—perfect for fast, short profits.
Bitcoin Ethereum (BTC/USD)(ETH/USD): It’s the most popular and liquid crypto, so there’s lots of activity, making it easier to jump on and off without getting stuck.
Why It Aims for 90% Wins (But Be Realistic)
The goal is to win 9 out of 10 trades by being super picky about when to trade—only jumping on when the trend, momentum, and volume are all perfect. But in real trading, markets can be unpredictable, so 90% is very hard to achieve. Still, this strategy tries to be as accurate as possible by avoiding bad moves and focusing on strong trends.
Risks for a New Trader
Leverage: Trading with 10x leverage means small price moves can lead to big losses if you’re not careful. Start with a demo account (pretend money) on TradingView or Binance to practice.
Learning Curve: This strategy uses technical terms (like HMAs, RSI) and tools you’ll need to learn over time. Don’t rush—just practice and ask questions!
How to Use It
Go to TradingView, load this strategy on a 5-minute BTC/USD futures chart on Binance.
Watch the green triangles (buy signals) and red triangles (sell signals) on the chart—they tell you when to trade.
Use the stops and targets to manage your trades—don’t guess, let the strategy guide you.
Start small, learn from each trade, and don’t risk money you can’t afford to lose.
This is like learning to ride a bike—start slow, practice, and you’ll get better. If you have more questions or want simpler tips, feel free to ask! Trading can be fun and rewarding, but it takes patience and practice.
"take profit" için komut dosyalarını ara

AO/AC Trading Zones Strategy [Skyrexio] Overview
AO/AC Trading Zones Strategy leverages the combination of Awesome Oscillator (AO), Acceleration/Deceleration Indicator (AC), Williams Fractals, Williams Alligator and Exponential Moving Average (EMA) to obtain the high probability long setups. Moreover, strategy uses multi trades system, adding funds to long position if it considered that current trend has likely became stronger. Combination of AO and AC is used for creating so-called trading zones to create the signals, while Alligator and Fractal are used in conjunction as an approximation of short-term trend to filter them. At the same time EMA (default EMA's period = 100) is used as high probability long-term trend filter to open long trades only if it considers current price action as an uptrend. More information in "Methodology" and "Justification of Methodology" paragraphs. The strategy opens only long trades.
Unique Features
No fixed stop-loss and take profit: Instead of fixed stop-loss level strategy utilizes technical condition obtained by Fractals and Alligator to identify when current uptrend is likely to be over. In some special cases strategy uses AO and AC combination to trail profit (more information in "Methodology" and "Justification of Methodology" paragraphs)
Configurable Trading Periods: Users can tailor the strategy to specific market windows, adapting to different market conditions.
Multilayer trades opening system: strategy uses only 10% of capital in every trade and open up to 5 trades at the same time if script consider current trend as strong one.
Short and long term trend trade filters: strategy uses EMA as high probability long-term trend filter and Alligator and Fractal combination as a short-term one.
Methodology
The strategy opens long trade when the following price met the conditions:
1. Price closed above EMA (by default, period = 100). Crossover is not obligatory.
2. Combination of Alligator and Williams Fractals shall consider current trend as an upward (all details in "Justification of Methodology" paragraph)
3. Both AC and AO shall print two consecutive increasing values. At the price candle close which corresponds to this condition algorithm opens the first long trade with 10% of capital.
4. If combination of Alligator and Williams Fractals shall consider current trend has been changed from up to downtrend, all long trades will be closed, no matter how many trades has been opened.
5. If AO and AC both continue printing the rising values strategy opens the long trade on each candle close with 10% of capital while number of opened trades reaches 5.
6. If AO and AC both has printed 5 rising values in a row algorithm close all trades if candle's low below the low of the 5-th candle with rising AO and AC values in a row.
Script also has additional visuals. If second long trade has been opened simultaneously the Alligator's teeth line is plotted with the green color. Also for every trade in a row from 2 to 5 the label "Buy More" is also plotted just below the teeth line. With every next simultaneously opened trade the green color of the space between teeth and price became less transparent.
Strategy settings
In the inputs window user can setup strategy setting:
EMA Length (by default = 100, period of EMA, used for long-term trend filtering EMA calculation).
User can choose the optimal parameters during backtesting on certain price chart.
Justification of Methodology
Let's explore the key concepts of this strategy and understand how they work together. We'll begin with the simplest: the EMA.
The Exponential Moving Average (EMA) is a type of moving average that assigns greater weight to recent price data, making it more responsive to current market changes compared to the Simple Moving Average (SMA). This tool is widely used in technical analysis to identify trends and generate buy or sell signals. The EMA is calculated as follows:
1.Calculate the Smoothing Multiplier:
Multiplier = 2 / (n + 1), Where n is the number of periods.
2. EMA Calculation
EMA = (Current Price) × Multiplier + (Previous EMA) × (1 − Multiplier)
In this strategy, the EMA acts as a long-term trend filter. For instance, long trades are considered only when the price closes above the EMA (default: 100-period). This increases the likelihood of entering trades aligned with the prevailing trend.
Next, let’s discuss the short-term trend filter, which combines the Williams Alligator and Williams Fractals. Williams Alligator
Developed by Bill Williams, the Alligator is a technical indicator that identifies trends and potential market reversals. It consists of three smoothed moving averages:
Jaw (Blue Line): The slowest of the three, based on a 13-period smoothed moving average shifted 8 bars ahead.
Teeth (Red Line): The medium-speed line, derived from an 8-period smoothed moving average shifted 5 bars forward.
Lips (Green Line): The fastest line, calculated using a 5-period smoothed moving average shifted 3 bars forward.
When the lines diverge and align in order, the "Alligator" is "awake," signaling a strong trend. When the lines overlap or intertwine, the "Alligator" is "asleep," indicating a range-bound or sideways market. This indicator helps traders determine when to enter or avoid trades.
Fractals, another tool by Bill Williams, help identify potential reversal points on a price chart. A fractal forms over at least five consecutive bars, with the middle bar showing either:
Up Fractal: Occurs when the middle bar has a higher high than the two preceding and two following bars, suggesting a potential downward reversal.
Down Fractal: Happens when the middle bar shows a lower low than the surrounding two bars, hinting at a possible upward reversal.
Traders often use fractals alongside other indicators to confirm trends or reversals, enhancing decision-making accuracy.
How do these tools work together in this strategy? Let’s consider an example of an uptrend.
When the price breaks above an up fractal, it signals a potential bullish trend. This occurs because the up fractal represents a shift in market behavior, where a temporary high was formed due to selling pressure. If the price revisits this level and breaks through, it suggests the market sentiment has turned bullish.
The breakout must occur above the Alligator’s teeth line to confirm the trend. A breakout below the teeth is considered invalid, and the downtrend might still persist. Conversely, in a downtrend, the same logic applies with down fractals.
In this strategy if the most recent up fractal breakout occurs above the Alligator's teeth and follows the last down fractal breakout below the teeth, the algorithm identifies an uptrend. Long trades can be opened during this phase if a signal aligns. If the price breaks a down fractal below the teeth line during an uptrend, the strategy assumes the uptrend has ended and closes all open long trades.
By combining the EMA as a long-term trend filter with the Alligator and fractals as short-term filters, this approach increases the likelihood of opening profitable trades while staying aligned with market dynamics.
Now let's talk about the trading zones concept and its signals. To understand this we need to briefly introduce what is AO and AC. The Awesome Oscillator (AO), developed by Bill Williams, is a momentum indicator designed to measure market momentum by contrasting recent price movements with a longer-term historical perspective. It helps traders detect potential trend reversals and assess the strength of ongoing trends.
The formula for AO is as follows:
AO = SMA5(Median Price) − SMA34(Median Price)
where:
Median Price = (High + Low) / 2
SMA5 = 5-period Simple Moving Average of the Median Price
SMA 34 = 34-period Simple Moving Average of the Median Price
The Acceleration/Deceleration (AC) Indicator, introduced by Bill Williams, measures the rate of change in market momentum. It highlights shifts in the driving force of price movements and helps traders spot early signs of trend changes. The AC Indicator is particularly useful for identifying whether the current momentum is accelerating or decelerating, which can indicate potential reversals or continuations. For AC calculation we shall use the AO calculated above is the following formula:
AC = AO − SMA5(AO) , where SMA5(AO)is the 5-period Simple Moving Average of the Awesome Oscillator
When the AC is above the zero line and rising, it suggests accelerating upward momentum.
When the AC is below the zero line and falling, it indicates accelerating downward momentum.
When the AC is below zero line and rising it suggests the decelerating the downtrend momentum. When AC is above the zero line and falling, it suggests the decelerating the uptrend momentum.
Now let's discuss the trading zones concept and how it can create the signal. Zones are created by the combination of AO and AC. We can divide three zone types:
Greed zone: when the AO and AC both are rising
Red zone: when the AO and AC both are decreasing
Gray zone: when one of AO or AC is rising, the other is falling
Gray zone is considered as uncertainty. AC and AO are moving in the opposite direction. Strategy skip such price action to decrease the chance to stuck in the losing trade during potential sideways. Red zone is also not interesting for the algorithm because both indicators consider the trend as bearish, but strategy opens only long trades. It is waiting for the green zone to increase the chance to open trade in the direction of the potential uptrend. When we have 2 candles in a row in the green zone script executes a long trade with 10% of capital.
Two green zone candles in a row is considered by algorithm as a bullish trend, but now so strong, that's the reason why trade is going to be closed when the combination of Alligator and Fractals will consider the the trend change from bullish to bearish. If id did not happens, algorithm starts to count the green zone candles in a row. When we have 5 in a row script change the trade closing condition. Such situation is considered is a high probability strong bull market and all trades will be closed if candle's low will be lower than fifth green zone candle's low. This is used to increase probability to secure the profit. If long trades are initiated, the strategy continues utilizing subsequent signals until the total number of trades reaches a maximum of 5. Each trade uses 10% of capital.
Why we use trading zones signals? If currently strategy algorithm considers the high probability of the short-term uptrend with the Alligator and Fractals combination pointed out above and the long-term trend is also suggested by the EMA filter as bullish. Rising AC and AO values in the direction of the most likely main trend signaling that we have the high probability of the fastest bullish phase on the market. The main idea is to take part in such rapid moves and add trades if this move continues its acceleration according to indicators.
Backtest Results
Operating window: Date range of backtests is 2023.01.01 - 2024.12.31. It is chosen to let the strategy to close all opened positions.
Commission and Slippage: Includes a standard Binance commission of 0.1% and accounts for possible slippage over 5 ticks.
Initial capital: 10000 USDT
Percent of capital used in every trade: 10%
Maximum Single Position Loss: -9.49%
Maximum Single Profit: +24.33%
Net Profit: +4374.70 USDT (+43.75%)
Total Trades: 278 (39.57% win rate)
Profit Factor: 2.203
Maximum Accumulated Loss: 668.16 USDT (-5.43%)
Average Profit per Trade: 15.74 USDT (+1.37%)
Average Trade Duration: 60 hours
How to Use
Add the script to favorites for easy access.
Apply to the desired timeframe and chart (optimal performance observed on 4h BTC/USDT).
Configure settings using the dropdown choice list in the built-in menu.
Set up alerts to automate strategy positions through web hook with the text: {{strategy.order.alert_message}}
Disclaimer:
Educational and informational tool reflecting Skyrex commitment to informed trading. Past performance does not guarantee future results. Test strategies in a simulated environment before live implementation
These results are obtained with realistic parameters representing trading conditions observed at major exchanges such as Binance and with realistic trading portfolio usage parameters.

Ultimate Stochastics Strategy by NHBprod Use to Day Trade BTCHey All!
Here's a new script I worked on that's super simple but at the same time useful. Check out the backtest results. The backtest results include slippage and fees/commission, and is still quite profitable. Obviously the profitability magnitude depends on how much capital you begin with, and how much the user utilizes per order, but in any event it seems to be profitable according to backtests.
This is different because it allows you full functionality over the stochastics calculations which is designed for random datasets. This script allows you to:
Designate ANY period of time to analyze and study
Choose between Long trading, short trading, and Long & Short trading
It allows you to enter trades based on the stochastics calculations
It allows you to EXIT trades using the stochastics calculations or take profit, or stop loss, Or any combination of those, which is nice because then the user can see how one variable effects the overall performance.
As for the actual stochastics formula, you get control, and get to SEE the plot lines for slow K, slow D, and fast K, which is usually not considered.
You also get the chance to modify the smoothing method, which has not been done with regular stochastics indicators. You get to choose the standard simple moving average (SMA) method, but I also allow you to choose other MA's such as the HMA and WMA.
Lastly, the user gets the option of using a custom trade extender, which essentially allows a buy or sell signal to exist for X amount of candles after the initial signal. For example, you can use "max bars since signal" to 1, and this will allow the indicator to produce an extra sequential buy signal when a buy signal is generated. This can be useful because it is possible that you use a small take profit (TP) and quickly exit a profitable trade. With the max bars since signal variable, you're able to reenter on the next candle and allow for another opportunity.
Let me know if you have any questions! Please take a look at the performance report and let me know your thoughts! :)

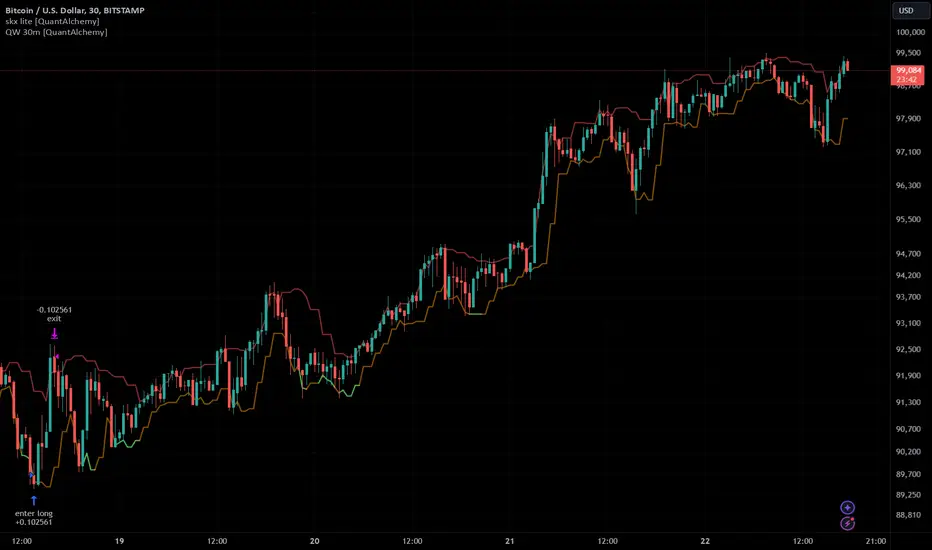
Skeleton Key LiteSkeleton Key Lite Strategy
Note : Every input, except for the API Alerts, depends on an external indicator to provide the necessary values for the strategy to function.
Definitions
Strategy Direction: The trading direction (long or short) as determined by an external source, such as an indicator.
Threshold Conditions:
- Enter Condition: Defines the condition for entering a trade.
- Exit Condition: Defines the condition for exiting a trade.
Stop Loss (SL):
- Trail SL: A trailing stop loss, dynamically updated during the trade.
- Basic SL: A static stop loss level.
- Emergency SL (ER SL): A fallback stop loss for extreme conditions.
- Max SL: The maximum risk tolerance in stop loss.
- Limit SL: A predefined stop loss that is executed as a limit order.
Take Profit (TP):
- Max TP: The maximum profit target for a trade.
- Limit TP: A predefined take profit level executed as a limit order.
API Alerts:
- API Entry: JSON-based configuration for sending entry signals.
- API Exit: JSON-based configuration for sending exit signals.
Broad Concept
The Skeleton Key Lite strategy script is designed to provide a generalized framework for orchestrating trade execution based on external indicators. It allows QuantAlchemy and others to encapsulate strategies into indicators, which can then be backtested and automated using this strategy script.
Inputs
Note : All inputs are dependent on external indicators for values except for the API Alerts.
Strategy Direction:
- Source: Direction signal from an external indicator.
- Options: `LONG` (`1`), `SHORT` (`-1`).
Trade Conditions:
- Enter: Source input, trigger for entry condition.
- Exit: Source input, trigger for exit condition.
Stops and Take Profits:
- Trail SL: Enable/disable dynamic trailing stop loss.
- Basic SL: Enable/disable static stop loss.
- Emergency SL: Enable/disable emergency stop loss.
- Max SL: Enable/disable maximum risk stop loss.
- Max TP: Enable/disable maximum take profit.
- Limit SL: Enable/disable predefined stop loss executed as a limit order.
- Limit TP: Enable/disable predefined take profit executed as a limit order.
Alerts:
- API Entry: Configurable JSON message for entry signals.
- API Exit: Configurable JSON message for exit signals.
How It Works
Trade Logic:
- Conditions for entering and exiting trades are evaluated based on the selected input sources.
Stop Loss and Take Profit Management:
- Multiple stop loss types (trailing, basic, emergency, etc.) and take profit levels are calculated dynamically during the trade entry. Trailing stop loss is updated during the trade based on the selected input.
API Alerts:
- Alerts are triggered using customizable JSON messages, which can be integrated with external trading systems or APIs.
Trade Execution:
- Enter: Initiates a new trade if entry conditions are met and there is no open position.
- Exit: Closes all trades if exit conditions are met or stop loss/take profit thresholds are hit.
Key Features
Customizable: Fully configurable entry and exit conditions based on external indicators.
Encapsulation: Integrates seamlessly with indicators, allowing strategies to be developed as indicator-based signals.
Comprehensive Risk Management:
- Multiple stop loss and take profit options.
- Emergency stop loss for unexpected conditions.
API Integration: Alerts are designed to interface with external systems for automation and monitoring.
Plots
The script plots key variables on the chart for better visualization:
Enter and Exit Signals:
- `enter`: Displays when the entry condition is triggered.
- `exit`: Displays when the exit condition is triggered.
Risk Management Levels:
- `trailSL`: Current trailing stop loss level.
- `basicSL`: Static stop loss level.
- `erSL`: Emergency stop loss level.
- `maxSL`: Maximum risk stop loss level.
Profit Management Levels:
- `maxTP`: Maximum take profit level.
- `limitTP`: Limit-based take profit level.
Limit Orders:
- `limitSL`: Limit-based stop loss level.
- `limitTP`: Limit-based take profit level.
Proposed Interpretations
Entry and Exit Points:
- Use the plotted signals (`enter`, `exit`) to analyze the trade entry and exit points visually.
Risk and Profit Levels:
- Monitor the stop loss (`SL`) and take profit (`TP`) levels to assess trade performance.
Dynamic Trail SL:
- Observe the `trailSL` to evaluate how the trailing stop adapts during the trade.
Limitations
Dependence on Indicators:
- This script relies on external indicators to provide signals for strategy execution.
No Indicator Included:
- Users must integrate an appropriate indicator for source inputs.
Back-Test Constraints:
- Back-testing results depend on the accuracy and design of the integrated indicators.
Final Thoughts
The Skeleton Key Lite strategy by QuantAlchemy provides a robust framework for automated trading by leveraging indicator-based signals. Its flexibility and comprehensive risk management make it a valuable tool for traders seeking to implement and backtest custom strategies.
Disclaimer
This script is for educational purposes only. Trading involves risk, and past performance does not guarantee future results. Use at your own discretion and risk.
Unlock the Power of Seasonality: Monthly Performance StrategyThe Monthly Performance Strategy leverages the power of seasonality—those cyclical patterns that emerge in financial markets at specific times of the year. From tax deadlines to industry-specific events and global holidays, historical data shows that certain months can offer strong opportunities for trading. This strategy was designed to help traders capture those opportunities and take advantage of recurring market patterns through an automated and highly customizable approach.
The Inspiration Behind the Strategy:
This strategy began with the idea that market performance is often influenced by seasonal factors. Historically, certain months outperform others due to a variety of reasons, like earnings reports, holiday shopping, or fiscal year-end events. By identifying these periods, traders can better time their market entries and exits, giving them an advantage over those who solely rely on technical indicators or news events.
The Monthly Performance Strategy was built to take this concept and automate it. Instead of manually analyzing market data for each month, this strategy enables you to select which months you want to focus on and then executes trades based on predefined rules, saving you time and optimizing the performance of your trades.
Key Features:
Customizable Month Selection: The strategy allows traders to choose specific months to test or trade on. You can select any combination of months—for example, January, July, and December—to focus on based on historical trends. Whether you’re targeting the historically strong months like December (often driven by the 'Santa Rally') or analyzing quieter months for low volatility trades, this strategy gives you full control.
Automated Monthly Entries and Exits: The strategy automatically enters a long position on the first day of your selected month(s) and exits the trade at the beginning of the next month. This makes it perfect for traders who want to benefit from seasonal patterns without manually monitoring the market. It ensures precision in entering and exiting trades based on pre-set timeframes.
Re-entry on Stop Loss or Take Profit: One of the standout features of this strategy is its ability to re-enter a trade if a position hits the stop loss (SL) or take profit (TP) level during the selected month. If your trade reaches either a SL or TP before the month ends, the strategy will automatically re-enter a new trade the next trading day. This feature ensures that you capture multiple trading opportunities within the same month, instead of exiting entirely after a successful or unsuccessful trade. Essentially, it keeps your capital working for you throughout the entire month, not just when conditions align perfectly at the beginning.
Built-in Risk Management: Risk management is a vital part of this strategy. It incorporates an Average True Range (ATR)-based stop loss and take profit system. The ATR helps set dynamic levels based on the market’s volatility, ensuring that your stops and targets adjust to changing market conditions. This not only helps limit potential losses but also maximizes profit potential by adapting to market behavior.
Historical Performance Testing: You can backtest this strategy on any period by setting the start year. This allows traders to analyze past market data and optimize their strategy based on historical performance. You can fine-tune which months to trade based on years of data, helping you identify trends and patterns that provide the best trading results.
Versatility Across Asset Classes: While this strategy can be particularly effective for stock market indices and sector rotation, it’s versatile enough to apply to other asset classes like forex, commodities, and even cryptocurrencies. Each asset class may exhibit different seasonal behaviors, allowing you to explore opportunities across various markets with this strategy.
How It Works:
The trader selects which months to test or trade, for example, January, April, and October.
The strategy will automatically open a long position on the first trading day of each selected month.
If the trade hits either the take profit or stop loss within the month, the strategy will close the current position and re-enter a new trade on the next trading day, provided the month has not yet ended. This ensures that the strategy continues to capture any potential gains throughout the month, rather than stopping after one successful trade.
At the start of the next month, the position is closed, and if the next month is also selected, a new trade is initiated following the same process.
Risk Management and Dynamic Adjustments:
Incorporating risk management with this strategy is as easy as turning on the ATR-based system. The strategy will automatically calculate stop loss and take profit levels based on the market’s current volatility, adjusting dynamically to the conditions. This ensures that the risk is controlled while allowing for flexibility in capturing profits during both high and low volatility periods.
Maximizing the Seasonal Edge:
By automating entries and exits based on specific months and combining that with dynamic risk management, the Ultimate Monthly Performance Strategy takes advantage of seasonal patterns without requiring constant monitoring. The added re-entry feature after hitting a stop loss or take profit ensures that you are always in the game, maximizing your chances to capture profitable trades during favorable seasonal periods.
Who Can Benefit from This Strategy?
This strategy is perfect for traders who:
Want to exploit the predictable, recurring patterns that occur during specific months of the year.
Prefer a hands-off, automated trading approach that allows them to focus on other aspects of their portfolio or life.
Seek to manage risk effectively with ATR-based stop losses and take profits that adjust to market conditions.
Appreciate the ability to re-enter trades when a take profit or stop loss is hit within the month, ensuring that they don't miss out on multiple opportunities during a favorable period.
In summary, the Ultimate Monthly Performance Strategy provides traders with a comprehensive tool to capitalize on seasonal trends, optimize their trading opportunities throughout the year, and manage risk effectively. The built-in re-entry system ensures you continue to benefit from the market even after hitting targets within the same month, making it a robust strategy for traders looking to maximize their edge in any market.
Risk Disclaimer:
Trading financial markets involves significant risk and may not be suitable for all investors. The Monthly Performance Strategy is designed to help traders identify seasonal trends, but past performance does not guarantee future results. It is important to carefully consider your risk tolerance, financial situation, and trading goals before using any strategy. Always use appropriate risk management and consult with a professional financial advisor if necessary. The use of this strategy does not eliminate the risk of losses, and traders should be prepared for the possibility of losing their entire investment. Be sure to test the strategy on a demo account before applying it in live markets.

Dow Theory based Strategy (Markttechnik)What makes this script unique?
calculates two trends at the same time: a big one for the overall strong trend - and a small one to trigger a trade after a small correction within the big trend
only if both trends (the small and the big trend) are in an uptrend, a buy signal is created: this prevents a buy signal from being generated in a falling market just because an upward movement begins in a small trend
the exit strategy can be configured very flexibly and individually: use the last low as stop loss and automatically switch to a trialing stop loss as soon as the take profit is reached (instead of finishing the trade)
the take profit strategy can also be configured - e.g. use the last high, a fixed percentage or a combination of it
plots each trade in detail on the chart - e.g. inner candles or the exact progression of the stop loss over the entire duration of the trade to allow you to analyze each trade precisely
What does the script do and how?
In this strategy an intact upward trend is characterized by higher highs and lower lows only if the big trend and the small trend are in an upward trend at the same time.
The following describes how the script calculates a buy signal. Every step is drawn to the chart immediately - see example chart above:
1. the stock rises in the big trend - i.e. in a longer time frame
2. a correction takes place (the share price falls) - but does not create a new low
3. the stock rises again in the big trend and creates a new high
From now on, the big trend is in an intact upward trend (until it falls below its last low).
This is drawn to the chart as 3 bold green zigzag lines.
But we do not buy right now! Instead, we want to wait for a correction in the big trend and for the start of a small upward trend.
4. a correction takes place (not below the low from 2.)
Now, the script also starts to calculate the small trend:
5. the stock rises in the small trend - i.e. in a shorter time frame
6. a small correction takes place (not below the low from 4.)
7. the stock rises above the high from 5.: a new high in the shorter time frame
Now, both trends are in an intact upward trend.
A buy signal is created and both the minor and major trend are colored green on the chart.
Now, the trade is active and:
the stop loss is calculated and drawn for each candle
the take profit is calculated and drawn to the chart
as soon as the price reaches the take profit or the stop loss, the trade is closed
Features and functionalities
Uptrend : An intact upward trend is characterized by higher highs and lower lows. Uptrends are shown in green on the chart.
The beginning of an uptrend is numbered 1, each subsequent high is numbered 2, and each low is numbered 3.
Downtrend: An intact downtrend is characterized by lower highs and lower lows. Downtrends are displayed in red on the chart.
Note that our indicator does not show the numbering of the points of the downtrend.
Trendless phases: If there is no intact trend, we are in a trendless phase. Trendless phases are shown in blue on the chart.
This occurs after an uptrend, when a lower low or a lower high is formed. Or after a downtrend, when a higher low or a higher high is formed.
Buy signals
A buy signal is generated as soon as a new upward trend has been formed or a new high has been established in an intact upward trend.
But even before a buy signal is generated, this strategy anticipates a possible emerging trend and draws the next possible trading opportunity to the chart.
In addition to the (not yet reached) buy price, the risk-reward ratio, the StopLoss and the TakeProfit price is shown.
With this information, you can already enter a StopBuy order, which is thus triggered directly with the then created buy signal.
You can configure, if a buy signal shall be created while the big trend is an uptrend, a downtrend and/or trendless.
Exit strategy
With this strategy, you have multiple possibilities to close your position. All of them can be configured within the settings. In general, you can combine a take profit strategy with a stop loss strategy.
The take profit price will be calculated once for each trade. It will be drawn to the chart for active trade.
Depending on your configuration, this can be the last high (which is often a resistance level), a fixed percentage added to the buy price or the maximum of both.
You can also configure that a trailing stop loss is used as soon as the take profit price is reached once.
The stop loss gets recalculated with each candle and is displayed and plotted for each active and finished trade. With this, you can easily check how the stop loss changed during your trades.
The stop loss can be configured flexibly:
Use the classic "trailing stop loss" that follows the price from below.
Set the stop loss to the last low and tighten it every time the small trend marks a new local low.
Confiure that the stop loss is tightened as soon as the break even is reached. Nothing is more annoying than a trade turning from a win to a loss.
Ignore inside candles (see description below) and relax the stop loss to use the outside candle for its calculation.
Inner candles
Inner candles are created when the candle body is within the maximum values of a previous candle (the outer candle). There can be any number of consecutive inner candles. As soon as you have activated the "Check inner candles" setting, all consecutive inner candles will be highlighted in yellow on the chart.
Prices during an inner candle scenario might be irrelevant for trading and can be interpreted as fluctuations within the outside candle. For this reason, the trailing stop loss should not be aligned with inner candles. Therefore, as soon as an inner candle occurs, the stop loss is reset and the low at the time of the outside candle is used as the calculation for the trailing stop loss. This will all be plotted for you on the chart.
Display of the trades:
All active and closed trades of the last 5 years are displayed in the chart with buy signal, sell, stop loss history, inside candles and statistics.
Backtesting:
The strategy can be simulated for each stock over the period of the last 5 years. Each individual trade is recorded and can be traced and analyzed in the chart including stop loss history. Detailed evaluations and statistics are available to evaluate the performance of the strategy.
Additional Statistics
This strategy immediately displays a statistic table to the chart area giving you an overview of its performance over the last years for the given chart.
This includes:
The total win/loss in $ and %
The win/loss per year in %
The active investment time in days and % (e.g. invested 10 of 100 trading days -> 10%)
The total win/loss in %, extrapolated to 100% equity usage: Only with this value can strategies really be compared. Because you are not invested between the trades and could invest in other stocks during this time. This value indicates how much profit you would have made if you had been invested 100% of the time - or to put it another way - if you had been invested 100% of the time in stocks with exactly the same performance. Let's say you had only one trade in the last 5 years that lasted, say, only one month and made 5% profit. This would be significantly better than a strategy with which you were invested for, say, 5 years and made 10% profit.
The total profit/loss per year in %, extrapolated to 100% equity usage
Notifications (alerts):
Get alerted before a new buy signal emerges to create an order if necessary and not miss a trade. You can also be notified when the stop loss needs to be adjusted. The notification can be done in different ways, e.g. by Mail, PopUp or App-Notification. This saves them the annoying, time-consuming and error-prone "click through" all the charts.
Settings: Display Settings
With these settings, you have the possibility to:
Show the small or the big trend as a background color
Configure if the numbers (1-2-3-2-3) shall be shown at all or only for the small, the big trend or both
Settings: Trend calculation - fine tuning
Drawing trend lines on a chart is not an exact science. Some highs and lows are not very clear or significant. And so it will always happen that 2 different people would draw different trendlines for the same chart. Unfortunately, there is no exact "right" or "wrong" here.
With the options under "Trend Calculation - Fine Tuning" you have the possibility to influence the drawing in of trends and to adapt it to your personal taste.
Small Trend, Big Trend : With these settings you can influence how significant a high or low has to be to recognize them as an independent high or low. The larger the values, the more significant a high or low must be to be recognized as such.
High and low recognition : With this setting you can influence when two adjacent, almost identical highs or lows should be recognized as independent highs or lows. The higher the value, the more different "similar" highs or lows must be in order to be recognized as such.
Which default settings were selected and why
Show Trades: true - its often useful to see all recent trades in the chart
Time Frame: 1 day - most common time frame (except for day traders)
Take Profit: combined 10% - the last high is taken as take profit because the trend often changes there, but only if there is at least 10% profit to ensure we do not risk money for a tiny profit
Stop Loss: combined - the last low is used as stop loss because the trend would break there and switch to a trailing stop loss as soon as our take profit is reached to let our profits run without risking them anymore
Stop Loss distance: 3% - we are giving the price 3% air (below the last low) to avoid being stopped out due to a short price drop
Trailing Stop Loss: 2% - we have to give the stop loss some room to avoid being stopped out prematurely; this is a value that is well balanced between a certain downside distance and the profit-taking ratio
Set Stop Loss to break even: true, 2% - once we reached the break even, it is a common practice to not risk our money anymore, the value is set to the same value as the trailing stop loss
Trade Filter: Uptrend - we only start trades if the big trend is an uptrend in the expectation that it will continue after a small correction
Display settings: those will not influence the trades, feel free to change them to your needs
Trend calculation - Fine Tuning: 1/1,5/0,05; influences the internal calculation for highs and lows and how significant they need to be to be considered a new high or low; the default values will provide you nicely calculated trends in the daily time frame; if there are too many or too few lows and highs according to your taste, feel free to play around and immediately see the result drawn to the chart; read the manual for a detailed description of this values
Note that you can (and should) configure the general trading properties like your initial capital, order size, slippage and commission.

Negroni Opening Range StrategyStrategy Summary:
This tool can be used to help identify breakouts from a range during a time-zone of your choosing. It plots a pre-market range, an opening range, it also includes moving average levels that can be used as confluence, as well as plotting previous day SESSION highs and lows.
There are several options on how you wish to close out the trades, all described in more detail below.
Back-testing Inputs:
You define your timezone.
You define how many trades to open on any given day.
You decide to go: long only, short only, or long & short (CAREFUL: "Long & Short" can open trades that effectively closes-out existing ones, for better AND worse!)
You define between which times the strategy will open trades.
You define when it closes any open trades (preventing overnight trades, or leaving trades open into US data times!!).
This hopefully helps make back-testing reflect YOUR trading hours.
NOTE: Renko or Heikin-Ashi charts
For ALL strategies, don’t use Renko or Heikin-Ashi charts unless you know EXACTLY the implications.
Specific to my strategy, using a renko chart can make this 85-90% profitable (I wish it was!!) Although they can be useful, renko charts don’t always capture real wicks, so the renko chart may show your trade up-only but your broker (who is not using renko!!) will have likely stopped you out on a wick somewhere along the line.
NOTE: TradingView ‘Deep backtesting’
For ALL strategies, be cynical of all backtesting (e.g. repainting issues etc) as well as ‘Deep backtesting’ results.
Specific to this strategy, the default settings here SHOULD BE OK, but unfortunately at the time of writing, we can’t see on the chart what exactly ‘deep backtesting’ is calculating. In the past I have noted a number of trades that were not closed at the end of the day, despite my ‘end of day’ trade closing being enabled, so there were big winners and losers that would not have materialized otherwise. As I say, this seems ok at these settings but just always be cynical!!
Opening Range Inputs
You define a pre-market range (example: 08:00 - 09:00).
You define an opening range (example: 09:00 - 09:30).
The strategy will give an update at the close of the opening range to let you know if the opening range has broken out the pre-market range (OR Breakout), or if it has remained inside (OR Inside). The label appears at the end of the opening range NOT at the bar that ‘broke-out’.
This is just a visual cue for you, it has no bearing on what the strategy will do.
The strategy default will trade off the pre-market range, but you can untick this if you prefer to trade off the opening range.
Opening Trades:
Strategy goes long when the bar (CLOSE) crosses-over the ‘pre-market’ high (not the ‘opening range’ high); and the time is within your trading session, and you have not maxed out your number of trades for the day!
Strategy goes short when the bar (CLOSE) crosses-under the ‘pre-market’ low (not the ‘opening range low); and the time is within your trading session, and you have not maxed out your number of trades for the day!
Remember, you can untick this if you prefer to trade off the opening range instead.
NOTES:
Using momentum indicators can help (RSI and MACD): especially to trade range plays in failed breakouts, when momentum shifts… but the strategy won’t do this for you!
Using an anchored vwap at the session open can also provide nice confluence, as well as take-profit levels at the upper/lower of 3x standard deviation.
CLOSING TRADES:
You have 6 take-profit (TP) options:
1) Full TP: uses ATR Multiplier - Full TP at the ATR parameters as defined in inputs.
2) Take Partial profits: ATR Multiplier - Takes partial profits based on parameters as defined in inputs (i.e close 40% of original trade at TP1, close another 40% of original trade at TP2, then the remainder at Full TP as set in option 1.).
3) Full TP: Trailing Stop - Applies a Trailing Stop at the number of points, as defined in inputs.
4) Full TP: MA cross - Takes profit when price crosses ‘Trend MA’ as defined in inputs.
5) Scalp: Points - closes at a set number of points, as defined in inputs.
6) Full TP: PMKT Multiplier - places a SL at opposite pre-market Hi/Low (we go long at a break-out of the pre-market high, 50% would place a SL at the pre-market range mid-point; 100% would place a SL at the pre-market low)'. This takes profit at the input set in option 1).

Strategic Multi-Step Supertrend - Strategy [presentTrading]The code is mainly developed for me to stimulate the multi-step taking profit function for strategies. The result shows the drawdown can be reduced but at the same time reduced the profit as well. It can be a heuristic for futures leverage traders.
█ Introduction and How it is Different
The "Strategic Multi-Step Supertrend" is a trading strategy designed to leverage the power of multiple steps to optimize trade entries and exits across the Supertrend indicator. Unlike traditional strategies that rely on single entry and exit points, this strategy employs a multi-step approach to take profit, allowing traders to lock in gains incrementally. Additionally, the strategy is adaptable to both long and short trades, providing a comprehensive solution for dynamic market conditions.
This template strategy lies in its dual Supertrend calculation, which enhances the accuracy of trend detection and provides more reliable signals for trade entries and exits. This approach minimizes false signals and increases the overall profitability of trades by ensuring that positions are entered and exited at optimal points.
BTC 6h L/S Performance
█ Strategy, How It Works: Detailed Explanation
The "Strategic Multi-Step Supertrend Trader" strategy utilizes two Supertrend indicators calculated with different parameters to determine the direction and strength of the market trend. This dual approach increases the robustness of the signals, reducing the likelihood of entering trades based on false signals. Here is a detailed breakdown of how the strategy operates:
🔶 Supertrend Indicator Calculation
The Supertrend indicator is a trend-following overlay on the price chart, typically used to identify the direction of the trend. It is calculated using the Average True Range (ATR) to ensure that the indicator adapts to market volatility. The formula for the Supertrend indicator is:
Upper Band = (High + Low) / 2 + (Factor * ATR)
Lower Band = (High + Low) / 2 - (Factor * ATR)
Where:
- High and Low are the highest and lowest prices of the period.
- Factor is a user-defined multiplier.
- ATR is the Average True Range over a specified period.
The Supertrend changes its direction based on the closing price in relation to these bands.
🔶 Entry-Exit Conditions
The strategy enters long positions when both Supertrend indicators signal an uptrend, and short positions when both indicate a downtrend. Specifically:
- Long Condition: Supertrend1 < 0 and Supertrend2 < 0
- Short Condition: Supertrend1 > 0 and Supertrend2 > 0
- Long Exit Condition: Supertrend1 > 0 and Supertrend2 > 0
- Short Exit Condition: Supertrend1 < 0 and Supertrend2 < 0
🔶 Multi-Step Take Profit Mechanism
The strategy features a multi-step take profit mechanism, which allows traders to lock in profits incrementally. This is achieved through four user-configurable take profit levels. For each level, the strategy specifies a percentage increase (for long trades) or decrease (for short trades) in the entry price at which a portion of the position is exited:
- Step 1: Exit a portion of the trade at Entry Price * (1 + Take Profit Percent1 / 100)
- Step 2: Exit a portion of the trade at Entry Price * (1 + Take Profit Percent2 / 100)
- Step 3: Exit a portion of the trade at Entry Price * (1 + Take Profit Percent3 / 100)
- Step 4: Exit a portion of the trade at Entry Price * (1 + Take Profit Percent4 / 100)
This staggered exit strategy helps in locking profits at multiple levels, thereby reducing risk and increasing the likelihood of capturing the maximum possible profit from a trend.
BTC Local
█ Trade Direction
The strategy is highly flexible, allowing users to specify the trade direction. There are three options available:
- Long Only: The strategy will only enter long trades.
- Short Only: The strategy will only enter short trades.
- Both: The strategy will enter both long and short trades based on the Supertrend signals.
This flexibility allows traders to adapt the strategy to various market conditions and their own trading preferences.
█ Usage
1. Add the strategy to your trading platform and apply it to the desired chart.
2. Configure the take profit settings under the "Take Profit Settings" group.
3. Set the trade direction under the "Trade Direction" group.
4. Adjust the Supertrend settings in the "Supertrend Settings" group to fine-tune the indicator calculations.
5. Monitor the chart for entry and exit signals as indicated by the strategy.
█ Default Settings
- Use Take Profit: True
- Take Profit Percentages: Step 1 - 6%, Step 2 - 12%, Step 3 - 18%, Step 4 - 50%
- Take Profit Amounts: Step 1 - 12%, Step 2 - 8%, Step 3 - 4%, Step 4 - 0%
- Number of Take Profit Steps: 3
- Trade Direction: Both
- Supertrend Settings: ATR Length 1 - 10, Factor 1 - 3.0, ATR Length 2 - 11, Factor 2 - 4.0
These settings provide a balanced starting point, which can be customized further based on individual trading preferences and market conditions.

Pullback_Power [JackTz]Welcome to Pullback_Power
Pullback_Power is a scalping strategy designed to capitalize on market retracements while incorporating unique dynamic features to enhance profitability.
Calculation
Pullback_Power purely uses moving averages to calculate both entry and exits. Exits can also be set to fixed percentages for both take profit and stop loss.
How the Strategy Works
Statistics show that markets normally do a recovery after each drop. Crypto markets can easily drop up to 20% within a few hours and then do a complete or partial recovery. Pullback_Power utilizes this known pattern alongside pyramiding. The strategy aims to catch one or more entries when the price drops, hoping to make profits when the market recovers from the drop. The fixed take profit and stop loss can be used to define your risk management, while the dynamic exit opportunity is riskier but provides the ability to stay in the trade longer while it recovers. Pullback_Power can make up to four entries. This means it utilizes pyramiding to spread out the entry points, but every exit is a full exit. It is not possible to partially exit.
Utility
Pullback_Power is a scalping strategy suitable for traders who operate with small trades and don't want to stay in the market for too long. Pullback_Power offers precise signals with no repainting. The strategy thrives in volatility, so crypto pairs might yield the best results, although this strategy can be adapted to work on all pairs and markets.
How to Automate It
Pullback_Power utilizes the standard placeholders of strategies on TradingView. This enables the trader to add every data point into a webhook, making it fully flexible to suit every trader's needs. To automate, create an alert, set the webhook URL, and add the JSON body needed for the webhook. An example of a simple JSON webhook with some of the standard strategy placeholders:
{
"side": "{{strategy.order.action}}",
"symbol": "{{ticker}}",
"amount": "{{strategy.order.contracts}}"
}
Read about all the standard placeholders that you can use here: TradingView - Standard strategy placeholders
Originality
Pullback_Power is unique in its ability to create precise signals without repainting while maintaining a solid approach to the pullback strategy. Its simplicity not only makes the strategy easy to use and understand but also highly effective. The simplicity reduces inputs, eliminating overfitting and limits each input to avoid incorrect usage. Many times, default settings are enough to achieve good backtesting results on almost all pairs available. Pullback_Power also differs from many other strategies by its solid code, which enhances performance and provides more reliable backtesting. The clean code increases the resilience and precision of the entries, making it less prone to errors.
Many pullback/scalping strategies normally only works on specific scopes of timeframes or pairs. Pullback_Power can easily be adapted to work on almost every scenario. The biggest change needed is the length of the moving average. The lower the timeframe, the higher a length is needed for proper results. I.e. on a 2H timeframe a length of 3 can yield good results. On a 5min timeframe the length might need to be as high as 70.
How to Use
To use Pullback_Power, add the script to your trading chart. By default, Pullback_Power opens four orders to optimize trade opportunities with a default fee value set at 0.1%. You can change these default settings in the Settings window under the Properties tab. To tailor Pullback_Power to your individual trading style, navigate to the Settings under the Input tab. Here you can configure various inputs to fit your trading style.
- Backtest settings , Start Date:
Defines the date of when the calculation starts. Use this to set the date of when the first trade could potentially emit.
- Backtest settings , End Date:
Defines the date of when the calculation ends. If there are any open trades after this date the close calculations are still live. It only makes sure that new orders cannot be opened after this date.
- Backtest settings , Only trade on weekdays:
This is a toggle you can enable or disable. If enabled it only allows new entries to happen during the normal week days, meaning Monday, Tuesday, Wednesday, Thursday and Friday.
Disable this to enable the script to open trades on all 7 days of the week.
- Open settings , Use dynamic long positions:
This toggle allows you to enable or disable the pullback level calculations after first trade.
If enabled, the calculations of level 2, 3 and 4 continues to happen after each bar, making the levels follow the price with the moving averages calculations.
If disabled, the calculations of the levels stop after the first trade. This means that the levels calculation at the point of the first trade stay fixed until all trades are closed.
You can see the difference of the green lines on the chart when you toggle this flag.
- Open settings , Data type:
This is the bar data used for the moving average calculation when opening trades. The possible data types are Open, High, Low, Close, HL2, HLC3, OHLC4, OC2 and HC2.
- Open settings , Source type:
This is the source used to calculate the moving average. The types available are: SMA, PCMA, EMA, WMA, DEMA, ZLEMA and HMA.
- Open settings , Length:
This is the length used for the moving average calculations. 3 means it takes the last 3 bars of historical data for the calculation.
- Open settings , Offset:
This defines if the calculation should use an offset for the historical data. This does not use a look-forward feature, but a look-backward feature. To prevent any possible repaints the offset can only be positive, not negative.
For instance, if the length is 3 and the offset is 0 the calculation is made from the last 3 bars, making it bar1, bar2 and bar3. If the length is 3 and the offset is 1 the calculation is made from bar2, bar3, and bar4 – offsetting the calculation by 1 bar.
- Leverage settings , Leverage liquidation (1-125):
The script itself does not handle any custom leverage calculation – this must be done in the Properties tabs and increasing the order size.
This setting is made to test a possible liquidation event if using leverage.
By setting this to higher than 1, a red line is visible after the first trade on the chart. This indicates the liquidation price.
If this setting is set to 25, the script will calculate the liquidation price from a x25 leverage. If this price is hit, the scripts stops emitting any orders and the background turns red.
You can use this to test if your settings could handle a certain level of leverage.
- Pullback settings , Pullback 1, 2, 3 and 4:
Each of these settings defines the entry price of each pullback level. If Pullback 1 is set to -6 it means that the moving average calculation should be 6% lower than the actual price.
The same logic applies to Pullback 2, 3 and 4.
Setting any level to 0 will disable the level – eliminating any orders to emit on that level.
This can be used to change the level of pyramiding down from 4 if needed.
If you do this, remember to also change the order size and the pyramiding value in the Properties tab accordingly.
- Close settings , Use dynamic TP and SL:
If enabled, script will exit all orders using the same but separate algorithm for moving averages. This enables the user to define if you want the orders to be closed if the price level of this moving average is hit. The price level for this calculation is visible on the chart by the blue line.
Although you can change the length and offset, as described underneath, this calculation uses the same data and source type defined in the Open settings area.
- Close settings , Length, Close:
This is the length used for the closing moving average calculations. 3 means it takes the last 3 bars of historical data for the calculation.
- Close settings , Offset, Close:
This defines if the calculation for the closing moving average should use an offset for the historical data. Just as the offset used for opening order, this does not use a look-forward feature, but a look-backward feature. To prevent any possible repaints the offset can only be positive, not negative.
For instance, if the length is 3 and the offset is 0 the calculation is made from the last 3 bars, making it bar1, bar2 and bar3. If the length is 3 and the offset is 1 the calculation is made from bar2, bar3, and bar4 – offsetting the calculation by 1 bar.
- Close settings , Use TakeProfit:
This toggle enables/disables a fixed take profit percentage.
- Close settings , TP %:
This sets the wanted % to reach on a take profit. This setting is ignored if the toggle above is disabled.
- Close settings , Use StopLoss:
This toggle enables/disables a fixed stop loss percentage.
- Close settings , SL %:
This sets the wanted % to reach on a stop loss. This setting is ignored if the toggle above is disabled.
Exit on Same Bar as Entry
By default, the script doesn't emit any exit orders on the same bar as the first entry order. Enable "Recalculation: After order is filled" to change this behavior.
Troubleshooting
While Pullback_Power is designed to provide reliable trading signals, you may encounter rare issues. One such issue could be receiving an error message stating "can't open orders with 0 or negative qty." If you encounter this error, it is likely due to specific conditions on the selected timeframe. To resolve this issue, change the timeframe on your trading chart.
Underlying Principles and Value Proposition
Pullback_Power leverages moving averages and volatility behavior to identify market retracements and capitalize on them. The strategy is rooted in the understanding that markets often experience temporary reversals or "pullbacks" before resuming their primary trend. By identifying these pullbacks and entering trades at opportune moments, Pullback_Power aims to capture quick profits from short-term market movements.
The dynamic and fixed calculations of Take Profit (TP) and Stop Loss (SL) levels enhances risk management, ensuring that potential losses are controlled while allowing room for profits to grow. The adaptive approach using the moving averages considers current market conditions, making the strategy flexible and responsive to changing volatility.
Moreover, Pullback_Power's non-repainting nature ensures the reliability of its signals, eliminating hindsight bias and providing traders with actionable insights based on real-time market data.
The strategy's simplicity and effectiveness make it accessible for traders of all experience levels. Whether you're a beginner looking to start scalping or an experienced trader seeking to diversify your trading approach, Pullback_Power offers a balanced blend of simplicity and sophistication to help you navigate the markets with confidence.
By focusing on clear, transparent principles and offering practical tools for risk management, Pullback_Power aims to provide tangible value to traders, empowering them to make informed decisions and optimize their trading outcomes.
Thank you for choosing Pullback_Power. I wish you successful trading!

Self Optimizing PSAR [Starbots]Self Optimizing Parabolic SAR Strategy (non-repainting)
Strategy constantly backtest 169 different combinations of Parabolic SAR indicator for maximum profitability and trades based on the best performing combination at that time.
---------------------------------------------------------------------------------------------------------
# Parabolic SAR (PSAR)
Parabolic SAR is a time and price technical analysis tool created by J. Welles Wilder and it's primarily used to identify points of potential stops and reverses. In fact, the SAR in Parabolic SAR stands for "Stop and Reverse". The indicator's calculations create a parabola which is located below price during a Bullish Trend and above Price during a Bearish Trend.
You can read more about this indicator here:
www.tradingview.com
-----------------------------------------------------------------------------------------------------------
The logic of self - optimizing:
This script is always backtesting 169 different combinations of Parabolic SAR settings in the background and saves the net. profit gained for every single one of them, then strategy selects and use the best performing combination of settings currently available for you to trade.
It's recalculating on every bar close - if one of the parameters starts performing better than others - have a higher net profit gain (it's literally like running 169 backtests with different settings) strategy switches to that parameter and continues trading like that until one of the other indicator parameters starts performing better again and switches to that settings.
We are optimizing our strategy based on 13 different 'Increment' factors of PSAR. We keep the 'Start' factor (default 0.02) and 'Max Value' factor (default 0.2) at default for all of them.
According to creator of this indicator J. Welles Wilder, we usually want to change only 'Increment' factors of PSAR in the calculation and leave the rest at default and that's what we do, we are changing only 'Increment' input.
Inputs : (you don't need to change them at all, it's a good balance for fast and slow detection of trends on PSAR)
Start = 0.02
Max value = 0.2
Increment1 = 0.005, Increment2 = 0.01, Increment3 = 0.015
Increment4 = 0.02, Increment5 = 0.025, Increment6 = 0.03
Increment7 = 0.035, Increment8 = 0.04, Increment9 = 0.045
Increment10 = 0.05, Increment11 = 0.055, Increment12 = 0.06
Increment13 = 0.065
PSAR buy / sell conditions looks like this:
PSAR1 = start 0.02, max value 0.2, increment1 0.005
PSAR2 = start 0.02, max value 0.2, increment2 0.01
PSAR3 = start 0.02, max value 0.2, increment3 0.015
PSAR4 = start 0.02, max value 0.2, increment3 0.02
...
PSAR13 = start 0.02, max value 0.2, increment13 0.065
Backtester in the background works like this:
backtest buying PSAR1 settings with selling PSAR1 settings => save net. profit
backtest buy PSAR1 with sell PSAR2 ;
backtest buy PSAR1 with sell PSAR3 ;
backtest buy PSAR1 with sell PSAR4 ;
..........
backtest buy PSAR1 with sell PSAR13 ;
..........
backtest buy PSAR13 with sell PSAR1 ;
backtest buy PSAR13 with sell PSAR2 ;
......
backtest buy PSAR13 with sell PSAR13 ;
=>
It will backtest 16x16=169 different PSAR settings and save their profits.
Your strategy then trades based on the best performing (highest net.profit) PSAR Setting currently available. It will check the calculations and backtest them on every new bar close - it's like running 169 strategies at time, and manually selecting the best performing one.
________________________________________________________________________
If you wish to use it as INDICATOR - turn on 'Recalculate after every tick' in Properties tab to have this script updating constantly and use it as a normal Indicator tool for manual trading.
Strategy example is backtested on Daily chart of SHIBUSDT Binance
All settings at default. (1000 capital, 100 order size, 0.1% fee, 1 tick slippage)
Settings:
-Start = default Parabolic SAR setting is 0.02
-Max Value = default Parabolic SAR setting is 0.2
--Recommended PSAR Increment settings:
0.02 is default, higher timeframes usually performs good on the faster Increment factors 0.03-0.05+, smaller timeframes on slow Increment factors 0.005-0.02. I recommend you the most common and logical 13 different Increment factors for optimizing in the strategy as default already (from 0.005 to 0.065 - strategy will then optimize and trade based on the most profitable combination).
- Noise-Intensity Filter 🐎0.00-0.20%🐢
This will punish the tiny trades made by certain combinations and give more advantage to big average trades. It's basically like fee calculation, it will deduct 0.xx% fee from every trade when optimizing on their backtests.
You will usually want to have it around 0.05-0.10% like your fees on exchange.
-> 🐎Less than <0.10% allows strategy to be VERY SENSITIVE to market. (a lot of trades - quick buy-sell changes)
-> 🐢More than >0.10% will slow down the strategy, it will be LESS SENSITIVE to market volatility. (less trades - slowly switches the trend direction from buy to sell)
Close Trades on Neutral
After a lot of Trades, Algo starts developing self-intelligence. It can also have a neutral score. (Grey Plots). Sell when the strategy is neutral.
Other settings:
-Take Profit, Multiple Take Profit, Trailing Take Profit, Stop Loss, Trailing Stop Loss with functional alerts.
-Backtesting Range - backtest within your desired time window. Example: 'from 01 / 01 /2020 to 01 / 01 /2023'.
- Strategy is trading on the bar close without repaint. You can trade Long-Sell/Short Sell or Long-Short both directions. Alerts available, insert webhook messages in the inputs.
- Turn on Profit Calendar for better overview of how your strategy performs monthly/annualy
- Notes window : add your custom comments in here or save your webhook message text inside here for later use. I find this helpful to save texts inside.
Recommended TF : 4h, 8h, 1d (Trend Indicators are good at detecting directions of the market, but we can have a lot of noise and false movements on charts, you want to avoid that and ride the long term movements)
This script is fairly simple to use. It's self-optimizing and adjusting to the markets on the go.

[Opening Range Breakout] S&R Strategy with Backtest (TSO) S&R Strategy with Backtest (TSO)
===========================================================================
===========================================================================
This indicator serves as a comprehensive full-cycle trading system, providing alerts at each stage of the trade, from opening to closure. The algorithm initiates by calculating the Opening/Pre-Market Price Range, waiting for a breakout to generate signals, and establishing TP (Take Profit and SL (Stop Loss) levels. The Opening/Pre-Market range, known for its robust support and resistance levels, is a key element. To filter out false breakouts and capture valid ones, the indicator incorporates a Smart Breakout feature, requiring confirmation through an initial breakout, a confirmation bounce, and a subsequent confirmation breakout. The indicator offers a variety of automated approaches for TP (Take-Profit) and SL (Stop-Loss) settings. These include leveraging opening range levels, both the most recent and historical S&R (Support and Resistance) levels, and an ATR (Average True Range) trailing stop-loss. This diverse set of tools ensure flexibility in tailoring TP (Take-Profit) and SL (Stop-Loss) parameters to different market conditions, contributing to a more adaptive and robust trading system. Additionally, a series of signal analysis tools, including candle bar analysis, divergence, and volume, enhance the precision of trading signals.
* Works with popular timeframes: 1M, 3M, 5M, 15M, 30M, 45M, 1H.
* Works best with Indices, Stocks, and Commodities, since there is pre-market price movement, which is used to obtain support and resistance price range.
* Every action of the trade is calculated on a confirmed closed candle bar state (barstate.isconfirmed), so the indicator will never repaint.
==============================================================
Indicator visual examples with various instruments:
---------------------------------------------------------------------------
Strategy Config: ORB_AAPL(NASDAQ)_15M
Example of Signal Cleanup confirmations via SMA and ATR. Take-Profit is calculated per optimal S&R (resistance) most recent levels.
---------------------------------------------------------------------------
Strategy Config: ORB_AMD(NASDAQ)_5M
Example of optimal S&R (resistance) level from previous day for Take-Profit 1 target, which gets hit.
---------------------------------------------------------------------------
Strategy Config: ORB_META(NASDAQ)_5M
Example of dynamic SL (Stop-Loss), which reduces the risk by moving to the new support level, which is at the same time is below the current price. Also Signal Cleanup confirmations via SMA, ATR and VWAP
---------------------------------------------------------------------------
Strategy Config: ORB_MSFT(NASDAQ)_15M
Example of automated ATR Trail Stop-Loss activation at no optimal S&R (support) feature.
---------------------------------------------------------------------------
Strategy Config: ORB_NFLX(NASDAQ)_3M
Example of a skipped LONG trade due to no optimal S&R (support) for Stop-Loss (can be seen per chart that it would be a loss trade). On another side, a SHORT SMA Confirmed trade hits all 3 profit targets.
---------------------------------------------------------------------------
Strategy Config: ORB_NVDA(NASDAQ)_15M
Example of no optimal support for SHORT Take-Profit targets, with ATR Trail Stop-Loss.
---------------------------------------------------------------------------
Strategy Config: ORB_SPY(AMEX)_15M
Example of several signal confirmations at the same time (SMA, VWAP, EWO) and S&R-TP-Entry-SL SL (Stop-Loss) system, which at trade open sets SL (Stop-Loss) per optimal S&R (since this is a LONG trade - support) and then moves to Entry at first take-profit.
===========================================================================
Trading open/close/TP/SL labels, plots and colors explanations:
---------------------------------------------------------------------------
>>> Opening/Pre-Market range: White dashed lines show opening range/pre-market levels with dotted white line extend along the Trading Schedule (if Trading Schedule is turned off - it will extend until next day).
>>> Smart Breakout: 1) Initial Breakout: "init_Brekout" | 2) Confirmation Bounce: "conf_Bounce" | 3) Confirmation Breakout: "conf_Breakout" (additional lables on chart can be hidden with only Confirmation Breakout shown).
>>> Additional S&R (Support and Resistance) lines: yellow - support, blue - resistance (can be hidden).
>>>>> LONG open: green "house" looking arrow below candle bar.
>>>>> SHORT open: red "house" looking arrow above candle bar.
>>>>> LONG/SHORT take-profit target: green/red circles (multi-profit > TP2/3/4/5 smaller circles).
>>>>> LONG/SHORT stop-loss target: green/red + crosses.
>>>>> LONG/SHORT take-profit hits: green/red diamonds.
>>>>> LONG/SHORT stop-loss hits: green/red X-crosses.
>>>>> LONG/SHORT EOD (End of Day | Intraday style) close (profitable trade): green/red squares.
>>>>> LONG/SHORT EOD (End of Day | Intraday style) close (loss trade): green/red PLUS(+)-crosses.
===========================================================================
STATS TABLE ///////////////////////////////////////////////////////////////
---------------------------------------------------------------------------
>>> Trading STATS table on the chart showing current trade direction, Last TP (Take-Profit) Taken, Current Trade PL (profit/loss in price difference from trade open to the very current state).
---------------------------------------------------------------------------
CUSTOM TRADING DATE RANGE /////////////////////////////////////////////////
---------------------------------------------------------------------------
>>>>> This feature can be used to manually set indicator trading range from and to a specific date and time. NOTE: This is not intended for a very long date range backtesting, utilize TradingView Strategy Tester for that.
* Use TradingView “Strategy Tester” to see Backtesting results
NOTE: If Strategy Tester does not show any results with Date Ranged fully unchecked, there may be an issue where a script opens a trade, but there is not enough TradingView power to set the Take-Profit and Stop-Loss and somehow an open trade gets stuck and never closes, so there are “no trades present”. In such case - manually check “Start”/“End” dates or use “Deep Backtesting” feature!
---------------------------------------------------------------------------
INTRADAY/TRADING SCHEDULE | ET (EASTERN TIMEZONE) ////////////////////////
---------------------------------------------------------------------------
>>> Trading Schedule - On/Off: This is where an Intraday Session or any custom session can be turned on and then scheduled.
>>>>> Trading Schedule - Time: Trade open Signals/Alerts time zone Hours. | NOTE: US Market Active Hours: 09:30 - 16:00 ET / Power Hour: 15:00 - 16:00 ET)
>>> Trading Schedule - EOD(End of Day) Close - On/Off: Close trade if still open by certain hour (set below).
>>>>> Trading Schedule - EOD(End of Day) Close - Hour (ET): US trading session closes at 4PM ET > 16:00.
Here is when the trade will close with EOD(End of Day) Close/Trading Cut Off Hour set to 16, which is end of US trading session:
1/3/5min > will close at 15:55pm ET
15min > will close at 15:45pm ET
30min > will close at 15:30pm ET
45min > will close at 15:45pm ET
60min > will close at 16:00pm ET
Here is when the trade will close with EOD(End of Day) Close/Trading Cut Off Hour set to 15, which is 1 hour before the end of US trading session (right before power hour starts):
1/3/5min > will close at 14:55pm ET
15min > will close at 14:45pm ET
30min > will close at 14:30pm ET
45min > will close at 14:45pm ET
60min > will close at 15:00pm ET
---------------------------------------------------------------------------
TRADE SIGNAL CONFIGURATION ////////////////////////////////////////////////
---------------------------------------------------------------------------
>>> Opening Range - Time Period (ET): Opening/Pre-Market Range time, which by default is set to US Session Pre-Market Range, can be customized to any time range as there are different market hours around the world and this setting can be customized to any time. Pre-Market Time/Price Range Hours(ET) | Pre-Market EU/Asia Hours: 4:00-9:30 ET | Pre-Market US (NY) Hours: 7:00-9:30 ET | Post-Market US Hours: 16:00-19:00 ET | First US Market Hour: 9:30-10:30 ET | Power Hour: 15:00-16:00)
>>> Opening Range - Levels Structure: determines how the price range is calculated, based on the highest/lowest price zones or based on the candle body bar.
>>> Opening Range - Breakout System: "Simple": bar close price has to simply break the opening range level | "Smart": After initial breakout (which is basically 'Simple' Breakout), a price come back is expected to the opening range level, a bounce, then a confirmation breakout with price closing ahead of the initial breakout.
>>>>> Opening Range - Smart Breakout: # of bars until Initial Breakout becomes invalid
>>>>> Opening Range - Smart Breakout: Bounce Settings, "Cross-Return" - LONG: Price has to cross down the initial breakout S&R, but never close below it; SHORT: Price has to cross up the initial breakout S&R, but then close above it; ||| "Cross-Close-Return" - LONG: At least 1 candle has to close below initial breakout S&R; SHORT: At least 1 candle has to close above initial breakout S&R.
>>>>> Alerts - Opening Range - Smart Breakout: Confirmation Bounce Alert. Trigger an alert at confirmation bounce. This is for live trading (especially scalping) Smart Breakout approach - to get ready to open the trade in the correct direction.
---------------------------------------------------------------------------
TAKE-PROFIT/STOP-LOSS CONFIGURATION ///////////////////////////////////////
---------------------------------------------------------------------------
>>> TP (Take-Profit) and SL (Stop-Loss): S&R Search - Left Bars: This setting is for calculating optimal S&R (Support and Resistance) levels (in combination with below - Right Bars) for S&R (Support and Resistance) TP (Take-Profit) levels calculations. NOTE: if at any point - there will be no available S&R (Support & Resistance) found for SL (Stop-Loss, 'S&R-Dynamic-SL' or 'S&R-Static-SL' setting, since both settings search for optimal SL (Stop-Loss) at trade open) or TP (Take-Profit, at any setting, since at trade open, an optimal TP (Take-Profit) level is searched) > SL (Stop-Loss) will automatically switch to trailing ATR-Trailing-SL and the trade will continue to run until it either hits ATR-Trailing-SL (Stop-Loss) or closes at EOD (End of Day).
>>> TP (Take-Profit) and SL (Stop-Loss): S&R Search - Right Bars: This setting is for calculating optimal S&R (Support and Resistance) levels (in combination with above - Left Bars) for S&R (Support and Resistance) TP (Take-Profit) levels calculations. NOTE: if at any point - there will be no available S&R (Support & Resistance) found for SL (Stop-Loss, 'S&R-Dynamic-SL' or 'S&R-Static-SL' setting, since both settings search for optimal SL (Stop-Loss) at trade open) or TP (Take-Profit, at any setting, since at trade open, an optimal TP (Take-Profit) level is searched) > SL (Stop-Loss) will automatically switch to trailing ATR-Trailing-SL and the trade will continue to run until it either hits ATR-Trailing-SL (Stop-Loss) or closes at EOD (End of Day).
>>> TP (Take-Profit) and SL (Stop-Loss): S&R Search - Custom Resolution: This is a custom timeframe setting specifically for S&R Search, it disregards current chart timeframe. This is great to use for scalping, for example: with main chart set to 1min and the custom timeframe set to 3min or 5min - there will be stronger support/resistance levels with more detailed price action.
>>> TP (Take-Profit) and SL (Stop-Loss): # of Bars (5000 max) to search back for optimal Support and Resistance levels: This is how many candles will be searched backwards for previous S&Rs (Support and Resistance) to find the optimal levels for TP (Take-Profit) and SL (Stop-Loss). NOTE: If SL (Stop-Loss) System is set to 'ATR-Trailing-SL' - this setting is only relevant for searching TP (Take-Profit) levels.
>>> TP (Take-Profit) and SL (Stop-Loss): At Trade Open - No S&R (Support and Resistance) found behavior: 'Skip Trade': If at trade open there are no S&R (Support and Resistance) levels for TP1 (Take-Profit 1) or SL (Stop-Loss) - trade is skipped. 'Open/ATR-Trailing-SL': If at trade open there are no S&R (Support and Resistance) levels for TP1 (Take-Profit 1) or SL (Stop-Loss), the trade will still be open with SL (Stop-Loss) set to 'ATR-Trailing-SL'.
>>> TP (Take-Profit) System: Pre-Market-Range-TP: All TP (Take-Profit) targets are calculated at trade open using the distance between Support and Resistance per Opening Pre-market Range and then divided by TP (Take-Profit) Divider, which can be set below; S&R-Current-Optimal-TP1: TP1 (Take-Profit) level is set per currently available S&R (Support & Resistance), if none available - historical S&R (Support & Resistance) levels will be searched, remaining TP (Take-Profit) targets (if selected, up to 5 # of TPs) are searched through most recent closest historical S&R (Support & Resistance) levels; S&R-Historic-Optimal-TP1: TP1 (Take-Profit) level is set per historically most recent closest available S&R (Support & Resistance) to the Entry price, remaining TP (Take-Profit) targets (if selected, up to 5 # of TPs) are searched through historical S&R (Support & Resistance) levels as well.
>>> TP (Take-Profit, Pre-Market-Range-TP) Divider #: This is for 'Pre-Market-Range-TP' setting only, where TP (Take-Profit) level is the distance between top/bottom levels of the opening range. It can be reduced by the divider #. (1 - full distance; 2 - 1/2 distance; 3 - 1/3 distance; etc.
>>> TP (Take-Profit) # of targets: It is wise to divide the trade into several profit targets. With this setting - up to 5 TP (Take-Profit) targets can be approached. The trade will be equally divided up by the selected # of TP (Take-Profit) targets.
>>> TP (Take-Profit) target(s) Consumed: Signal Bar consuming Take-Profits - trade signal bar is big enough to 'consume'/close ahead of the first TP setting > the signal can either be skipped, or all Take-Profit targets pushed ahead by average bar size).
>>> TP (Take-Profit) Offset - On/Off: This is a feature where TP (Take-Profit) target will be considered taken even if the price never crosses the target(s), but comes close enough (based on the offset amount). Set the offset amount below.
>>>>> TP (Take-Profit) Offset - Amount: Some Examples: (for SPY 0.1 would be $0.10 offset - if TP1 is $400 and price hits $399.90 > TP1 considered taken/signal shown/alert) | NOTE: For EURUSD, it is very different and if wrong will show TP1 immediately at trade open, typical good offset for EURUSD is: 0.0005 | Similar for BTCUSD, for example: 10 - $10 offset, if TP is $15,000 > $14,990.
>>> SL (Stop-Loss) System: 'Pre-Market-Range-SL': SL (Stop-Loss) is set to the opposite market range level from trade direction; 'S&R-Static-SL': SL (Stop-Loss) is set at trade open per optimal most recent S&R level and remains there until trade closes; 'S&R-Dynamic-SL': SL (Stop-Loss) is set at a trade open per optimal S&R (Support and Resistance) level from the most recent AND historical S&Rs (Support and Resistance), with every bar closed it will check if there are new S&Rs (Support and Resistance) levels, if these levels appear closer to the current price then current level - it will move SL (Stop-Loss) to that level, therefore reducing the risk; 'ATR-Trailing-SL': SL (Stop-Loss) is trail-following the ATR (Average True Range) line, NOTE: If at signal trigger, ATR will be against the trade direction - trade open signal will be skipped; 'S&R-TP-Entry-SL': SL (Stop-Loss) initially is set per S&R, then moves to Entry price at the very first TP (Take-Profit) hit and remains there until trade closes; 'S&R-TP-Trail-SL': SL (Stop-Loss) initially is set per S&R, then moves to Entry at TP1 (Take-Profit 1) hit, then keeps trailing per previously taken profit targets (TP2 taken, SL moves to TP1 | TP3 taken, SL moves to TP2 | TP4 taken, SL moves to TP3). NOTE: 'ATR-Trailing-SL' will not switch automatically if 'S&R-Dynamic-SL', S&R-TP-Entry-SL', 'S&R-TP-Trail-SL' system is selected, as already the most optimal SL (Stop-Loss) level is calculated - it will switch automatically only with 'S&R-Static-SL' system.
>>> SL (Stop-Loss) - On/Off: Without SL (Stop-Loss), unless EOD (End of Day) Close is turned on - there will be no SL (Stop-Loss) at all!
---------------------------------------------------------------------------
SIGNAL ANALYSIS AND CLEANUP ///////////////////////////////////////////////
---------------------------------------------------------------------------
>>> Signal Cleanup - Bar Color: Include Bar Color (bullish/bearish) confirmation, LONG signal will only be opened if signal bar is green/bullish, SHORT if red/bearish.
>>> Signal Cleanup - Bar Directional Structure: Skip opposite bar structure types signals (For example: bearish green hammer).
>>> Signal Cleanup - Bar Doji Skip: Skip doji (indecisive) candles signals.
>>> Signal Cleanup - EWO (Elliott Wave Oscillator): Include EWO (Elliott Wave Oscillator), LONG will only be opened if EWO is bullish / SHORT if EWO is bearish.
>>> Signal Cleanup - VWAP (Volume-Weighted Average Price): Include VWAP (Volume-Weighted Average Price), LONG will only be opened if price is above VWAP / SHORT if price is below VWAP.
>>> Signal Cleanup - MA (Moving Average) Confirmation: Include MA (Moving Average), LONG will only be opened if MA is bullish / SHORT if MA is bearish.
>>> Signal Cleanup - ATR (Average True Range): Include ATR (Average True Range) confirmation, LONG will only be opened if ATR is bullish / SHORT if ATR is bearish.
>>> Signal Cleanup - Divergence(RSI + MACD): Include Divergence (RSI + MACD ) confirmation, LONG will only be opened if Divergence is bullish / SHORT if Divergence is bearish.
>>> Signal Cleanup - Volume % Strength: Include Volume strength/percentage confirmation, LONG/SHORT will only be opened with strong Volume matching the signal direction | By default, strong Volume percentage is set to 150% and weak to 50%.
>>> Signal Cleanup - Volume Above Average: Include Volume Above Moving Average (Volume closing bar closes above volume moving average) confirmation, LONG/SHORT will only be opened with Volume above average - Volume closed bar color must match the closed price color (bullish/bearish direction) + Volume bar must be closed above volume MA line).
---------------------------------------------------------------------------
===========================================================================
||||||||||||||||||||||||||||||||||| *** ||||||||||||||||||||||||||||||||||| *** |||||||||||||||||||||||||||||||||||
||||||||||||||||||||||||||||||||||| *** ||||||||||||||||||||||||||||||||||| *** |||||||||||||||||||||||||||||||||||
TP System - VERY IMPORTANT INFO!
-------------------------------------------------------------------------------------------------------------------
"TP PERCENTAGE" - amount by which current trade/position needs to be reduced/partially closed/sold.
-------------------------------------------------------------------------------------------------------------------
TP System: Dynamic
"TP PERCENTAGE" - will always be the same amount (trade/position size divided by the # of take-profit(TP) targets) and percentage to be closed will always be of the ORIGINAL trade/position.
-------------------------------------------------------------------------------------------------------------------
TP System: Static
"TP PERCENTAGE" - will always be the same amount IF take-profit(TP) targets are hit 1-by-1 (TP1 > TP2 > TP3 > TP4 > TP5), otherwise it will vary and unless it is a 1st take-profit(TP1), the REMAINING trade/position size will always be smaller than original and therefore the percentage to be closed will always be of the REMAINING trade/position and NOT the original one!
-------------------------------------------------------------------------------------------------------------------
"TP PERCENTAGE" CheatSheet (these are the only percentages you may see)
-----------------------------------------------------------------------
TP PERCENTAGE---Close/Sell Amount-------------Example (trade size: 50 stocks)
20%-------------trade size * 0.2--------------50 * 0.2 = 10 stocks
25%-------------trade size * 0.25-------------50 * 0.25 = 12.5(~13) stocks
34%-------------trade size * 0.34-------------50 * 0.34 = 17 stocks
40%-------------trade size * 0.4--------------50 * 0.4 = 20 stocks
50%-------------trade size * 0.5--------------50 * 0.5 = 25 stocks
60%-------------trade size * 0.6--------------50 * 0.6 = 30 stocks
66%-------------trade size * 0.66-------------50 * 0.66 = 33 stocks
75%-------------trade size * 0.75-------------50 * 0.75 = 37.5(~38) stocks
80%-------------trade size * 0.8--------------50 * 0.8 = 40 stocks
100%------------trade size--------------------50 = 50 stocks
-----------------------------------------------------------------------
If for any reason a portion of the current/remaining trade closed at such occurrence was slightly wrong, it is not an issue. Such occurrences are rare and with slight difference in partial TP closed is not significant to overall performance of our algorithms.
||||||||||||||||||||||||||||||||||| *** ||||||||||||||||||||||||||||||||||| *** |||||||||||||||||||||||||||||||||||
||||||||||||||||||||||||||||||||||| *** ||||||||||||||||||||||||||||||||||| *** |||||||||||||||||||||||||||||||||||
===========================================================================
Alert Settings (you don’t have to touch this section unless you will be using TradingView alerts through a Webhook to use with trading bot)
---------------------------------------------------------------------------
Here is how a LONG OPEN alert looks like.
NOTE: Each label , , etc. is customizable, you can change the text of it within indicator Input settings.
ALERT >>>>>>>>>>>>>>>>>>>>>>>>>>>>>>>>>>>>>>>>>>>>>>>
COIN: BTCUSD
TIMEFRAME: 15M
LONG: OPEN
ENTRY: 20000
TP1: 20500
TP2: 21000
TP3: 21500
TP4: 22500
TP5: 23500
SL: 19000
Leverage: 0
---------------------------------------------------------------------------
Here is how a TP1 alert will look with 5 TPs breakdown of the trade.
NOTE1: Next to TP1 taken it will show at which price it was triggered.
NOTE2: Next to "TP Percentage" it shows how much of the CURRENT/ACTIVE/REMAINING trade needs to be closed.
NOTE2: If TP2/3/4/5 comes before TP1 - the alert will tell you exactly how many percent of the trade needs to be closed!
ALERT >>>>>>>>>>>>>>>>>>>>>>>>>>>>>>>>>>>>>>>>>>>>>>>
COIN: BTCUSD
TIMEFRAME: 15M
LONG: TP1
TP1: 20500
TP Percentage: 20%
---------------------------------------------------------------------------
Here is how an alert will look for LONG - STOP-LOSS.
ALERT >>>>>>>>>>>>>>>>>>>>>>>>>>>>>>>>>>>>>>>>>>>>>>>
COIN: BTCUSD
TIMEFRAME: 15M
ENTRY: 20000
LONG: SL
SL: 19000
---------------------------------------------------------------------------
Here is how an alert will look for LONG - EOD (End of Day) In Profit close.
ALERT >>>>>>>>>>>>>>>>>>>>>>>>>>>>>>>>>>>>>>>>>>>>>>>
COIN: BTCUSD
TIMEFRAME: 15M
LONG: EOD-Close (profit)
ENTRY: 20000
EOD-Close: 21900
===========================================================================
Adding Alerts in TradngView
---------------------------------------------------------------------------
-Add indicator to chart and make sure the correct strategy is configured (check Backtesting results)
-Right-click anywhere on the TradingView chart
-Click on Add alert
-Condition: Select this indicator by it’s name
-Immediately below, change it to "alert() function calls only", as other wise there will be 2 alerts for every alert!
-Expiration: Open-ended (that may require higher tier TradingView account, otherwise the alert will need to be occasionally re-triggered)
-Alert name: Whatever you desire
-Hit “Create”
-Note: If you change ANY Settings within the indicator – you must DELETE the current alert and create a new one per steps above, otherwise it will continue triggering alerts per old Settings!
===========================================================================
If you have any questions or issues with the indicator, please message me directly via TradingView.
---------------------------------------------------------------------------
Good Luck! (NOTE: Trading is very risky, past performance is not necessarily indicative of future results, so please trade responsibly!)
---------------------------------------------------------------------------
NOTE: There seems to be a strange glitch when strategy is running live, it will show "double-take" take-profits labels on the chart. This is not affecting the script logic and backtesting results, if you simply change the timeframe real quick to something else then back - it will no longer show the duplicate orders... this must be some sort of a glitch as every alert was thoroughly tested to make sure everything is working!

Broadview Algorithmic StudioWelcome! This is the writeup for the Broadview Algorithmic Studio.
There are many unique features in this script.
- Broadview Underpriced & Overpriced
- Broadview Blackout Bollinger Bands
- Trailing Take Profit Suite
- Algorithmic Weights
- VSA Score
- Pip Change Log
- Activation Panel
- Weight Scanner
There are 116 primary inputs that allow users to algorithmically output unique DCA signal-sets. There are 85 inputs that allow users to control individual lengths, levels, thresholds, and multiplicative weights of the script. You will not find any other script with this many inputs, properly strung together for you to produce unlimited strategies for any market. The entire premise for the Broadview Algorithmic Studio is for users to be able to have extensive-cutting-edge features that allow them to produce more strategies, having control over every element that outputs a signal set. The number of unique strategies you can output with this script is VAST, and each continues to follow a safe DCA methodology.
This script is ready for use with 3Commas, interactive brokers, and other means of automation. It provides detailed information on Base Orders and Safety Orders, giving the number, cumulative spending, position average, and remaining balance for each SO in the series. Using this script we will explore the depths of strategic volume scaling, and the algorithms we use to determine spending.
Let me first start by saying the number of safe DCA-friendly signal-sets this script can output is absolutely staggering.
Let's limit the scope just to the Broadview Underpriced & Overpriced and Broadview Dominance indicators.
Each band of the Dominance Suite can be controlled individually with unique lengths, levels, and weights. This means the Dominance Suite can establish Bearish or Bullish dominance, in any market condition, and give it a unique overloading weight. The Broadview Underpriced & Overpriced indicator finally gives us the ability to establish these "market conditions" first with cycles. Of all the cycles this indicator establishes, the two primary are Underpriced & Overpriced. We determine this using a composite Overbought & Oversold with an Exponential Moving Average. So the script can now know, what cycle it is in, who is dominant during that cycle, and exactly how much weight in volume scaling the order should have.
Brand new is the ability for indicators of this level to be able to talk together in a single script. The Broadview Underpriced & Overpriced indicator and the Broadview Dominance indicator can inform one another across multiple vectors, create a unique market snapshot, and give that snapshot a unique weight every bar. The unique weight is compiled in the volume scaling math, thus giving us an automated-strategic-safe and quite efficient volume scaling for every order. In our coming updates we will explore this synergy to its very deepest layers. These indicators can be laced together in many ways, called vectors.
Only in the Algorithmic Studio do we explore these depths and yield those findings, features, and inputs to the user.
Let me take a quick break to explain another area-of-opportunity for our research and development.
The VSA Score is something we've tried before, but until the creation of the Broadview Blackout Bollinger Bands Auto Indicator it was not possible. The concept we want to explore is "Positional Honing". Over time we want users and the script itself to be able to understand the difference between a script-config that produces a high number of Hits, from a configuration that produces a high number of "Misses". The Volume Scaling Accuracy Score uses the BBB Auto Indicator as a heavily reliable, non-repainting, method of determining what the very-best signals for increased volume-scaling are.
Increased volume scaling is denoted by the near-white highlighter line running vertically. This line will either fall inside the BBB Auto Indicator bands (which are hidden), or, they will fall below and outside the BBB Auto bands. If increased spending happens inside the bands it's a "Miss". If increased spending happens below and outside the bands, it's a Hit. Oftentimes misses are actually pretty good spots for extra spending, which helps lower your position average, but Hits are always better. The Hits that the BBB Auto Indicator provides are extremely good.
Let's talk about the Trailing Take Profit Suite. This suite allows us to set a trailing take profit which is a feature that lets one maximize their profits. If the trailing take profit is engaged, then when the regular take profit is hit, it will trigger, denoted in red vertical lines, and the trailing take profit will look for a specified rate of change before it actually takes profit. This usually helps traders in those times when their regular take profit was set too low, allowing them to maximize their profits with a Trailing Take Profit.
For the moment, let's think about our scores. In the dashboard you'll notice a score beginning the Pip Change Log, the VSA Score, and the Activation Panel.
These scores use a new kind of logistic correlation formula where 4 digits are given to activation, rather than 1. This is to allow room for a future concept in AI we call "Deadzones" or you can think of it as impedance. This is not a bias in logistic regression. It's an entirely different concept. A neuron, which a perceptron attempts to mimic, has a bias.. but it also has a sort of electrical resistance. This is because a neuron is individually-alive entity. So a perceptron, as it were, would need to have both a bias and a natural resistance, or deadzone.
It is a lot of fun to watch the scores and how they react during playback. They tend to smooth trends but are also quite quick to correct to accuracy. In the future we will add the deadzones and biases to the scores. This should help both users and the script produce better signal sets. The Pip Change Log is an indicator that measures Rate of Change in Pips. This is one that I am particularly excited to study, as I am a huge fan of ROC. The Activation Panel shows these scores for 4 primary indicators: On Balance Volume, Relative Strength Index, Average Directional Index, and Average True Range.
Having the Pip Change Log, VSA Score, and Activation Panel up on the dashboard with their logistic correlation scores allows traders to study markets and setups quite intimately. The weight scanner at the bottom allows users to track the cumulative applied multiplicative weights during playback. The massive number of inputs, connected vectors of indicators, input-weights, lengths, levels, and thresholds sets up all the algorithmic infrastructure for powerusers to explore every idea and strategy output they could imagine. Also with the connected vector infrastructure we can deepen our indicators in a way where, "How they talk to each other.", comes first in every development conversation.
The Algorithmic Studio is for the Power-user.
These are not basic equations coming together to determine spending. This is a massive multi-layered-perceptron with everything from Trailing-Take-Profits to strategic-automatic algorithmic downscaling. The Broadview Algorithmic Studio gives a home to the poweruser who wants access to everything in a trading and investing AI, right up until the backpropagation. The Broadview Algorithmic Studio, gives users the ability to sit in the chair of the would-be AI.
Thank you.

Good Mode RSI v2► Description:
"Good Mode RSI v2" is a powerful trading strategy designed to provide informed trading decisions. This script utilizes the popular RSI (Relative Strength Index) indicator to identify potential buying and selling opportunities in the market. It goes beyond the traditional use of RSI by incorporating carefully selected parameters to enhance its effectiveness. The strategy stands out for its customized combination of RSI levels and stop-loss/take-profit thresholds, allowing for precise trade entries and exits while effectively managing risk.
► How to Use:
To utilize the "Good Mode RSI v2" strategy, follow these steps:
1. Apply the script to your desired trading instrument and timeframe in TradingView.
2. Monitor the chart for trade signals generated by the strategy.
3. When the RSI reaches the sell level of 96, a sell signal is generated. Consider placing a sell order to take advantage of potential downward price movements.
4. take-profit level at 60 to secure profits in a strong downtrend.
5. When the RSI drops below the buy level of 4, a buy signal is generated. Consider placing a buy order to enter the market at a favorable price.
6. take-profit level at 30 to secure profits in a strong uptrend.
7. Monitor the RSI indicator on the chart to stay updated on its current value and anticipate potential trade signals.
Please note that trading decisions should be made based on a comprehensive analysis of multiple factors, including market conditions, trend analysis, and risk management. The "Good Mode RSI v2" strategy can serve as a valuable tool in your trading journey, but it should be used in conjunction with your own research and analysis.
► About it:
The "Good Mode RSI v2" strategy is not a mere replication or slight modification of existing strategies or indicators. It has been carefully crafted to provide traders with an original and purposeful approach to trading using the RSI indicator. The strategy's unique configuration of RSI levels and stop-loss/take-profit thresholds allows for improved performance and profitability. Backtesting results have shown impressive metrics, including a gain factor of 2.445 and a compelling profitability of 78.07% during the testing period.
► Referrals:
If you have any questions or need further assistance with the "Good Mode RSI v2" strategy, feel free to ask. Good luck with your trading endeavors!
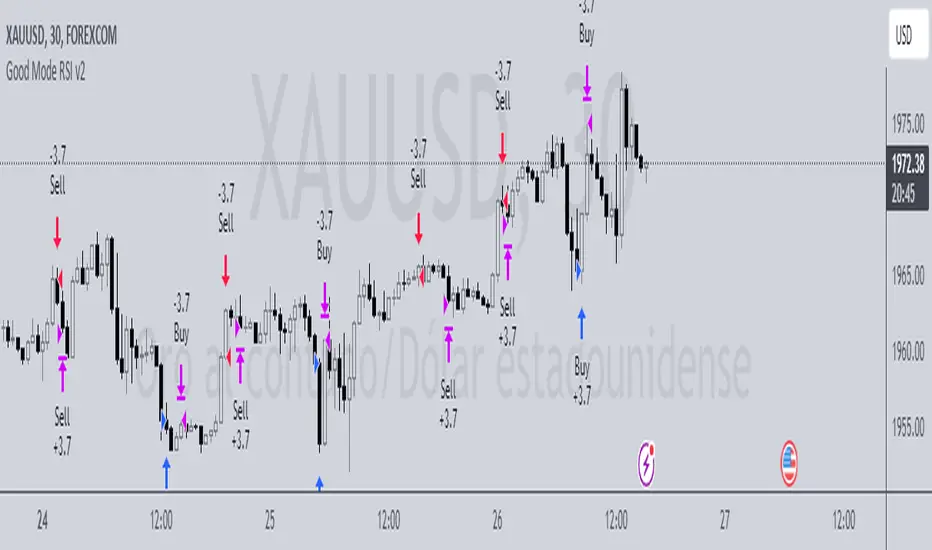
Moving Average Rainbow (Stormer)This strategy is based and shown by trader and investor Alexandre Wolwacz "Stormer".
Overview
The strategy uses 12 moving averages (default EMA) to identify trends and generate trading signals opening positions.
Allowing to select the type of moving average and length to be used.
The conditions includes relationship between moving averages, the position of the current price relative to the moving averages, and the occurrence of certain price patterns.
Calculation
The mean moving averages is calculated by adding all the 12 moving averages and dividing by 12, the value is used to help to identify trend and possible condition to open position.
The 12 moving averages is spliced by 3 ranges, initial range (moving average lines 1 to 4), middle range (moving average lines 5 to 8) and end range (moving average lines 9 to 12). These ranges helps to identify potential trend and market turn over.
The moving average touch price is a relationship between the low price (uptrend) or high price (downtrend) with the moving average lines, it identifies where the price (low/high) has reached the the moving average line. Fetching the value to help for opening position, set stop loss and take profit.
Since the stop loss is based and set from the previous moving average touch price value, when position is about to be open and setting the stop loss value, there is a verification to check both current and previous moving average touch price to recalculate the stop loss value.
The turnover trend checks for a possible market turnover event, setting up a new profit target, this setting when enabled is to be helpful when a turnover occurs against the position to exit position with some profit based on highest high price if long or lowest low price if short.
The turnover signal is similar to turnover trend. The difference is that when this setting is enabled and it triggers, it simply exit the current position and opens up a reverse position, long goes short and short goes long. And there is an complement optional that checks current price exit profitable.
Entry Position
Long Position:
Price is higher than the mean moving averages. Meaning possible uptrend.
The lines of the middle range from the moving averages are in increasing order. Meaning possible uptrend.
The current high pierced up previous high.
Fetch the previous value of the moving average touch price. Meaning the low price has touched one of the moving average lines, which that value is conditioning to open position.
Short Position:
Price is lower than the mean moving averages. Meaning possible downtrend.
The lines of the middle range from the moving averages are in decreasing order. Meaning possible downtrend.
The current low pierced down previous low.
Fetch the previous value of the moving average touch price. Meaning the high price has touched one of the moving average lines, which that value is conditioning to open position.
Risk Management
Stop Loss:
The stop loss is based from the previous moving average touch price value, high price for short and low price for long or occurs an verification to check for both current and previous moving average touch price value and a recalculation is done to set the stop loss.
Take Profit:
According to the author, the profit target should be at least 1:1.6 the risk, so to have the strategy mathematically positive.
The profit target is configured input, can be increased or decreased.
It calculates the take profit based on the price of the stop loss with the profit target input.
Turnover Trend
Long Position:
The moving averages initial range lines signals a possible market turnover. Meaning long might be going short.
Fetches the highest high hit since the opening of the position, setting that value to the new profit target.
Short Position:
The moving averages initial range lines signals a possible market turnover. Meaning short might be going long.
Fetches the lowest low hit since the opening of the position, setting that value to the new profit target.

3Commas Bot DCA Backtester & Signals FREEThis is a DCA Strategy backtester + signals, built to emulate the 3Commas DCA bots. It uses your choice of 4 different buy signals, 2 of which can be adjusted in the settings. Everything is customizable so you can backtest specific settings with different buy signals and find the best performing strategy for your risk tolerance and capital. It can be used to backtest strategies on stocks as well, but just make sure your base order is larger than the share price for the entire backtesting range or it will not calculate properly.
You can use this template to code your own buy signals and then backtest them as a DCA strategy if you know some basic pine script.
The indicator shows all of your backtesting orders on the chart. The red line is your take profit level, the blue line is your average price level, the white line is your first order and the green lines are your average down orders. If you enable a stop loss in the settings your stop loss will be shown as an orange line once all of your average down orders have been hit, it will not be set until price has dipped below your covered trading range.
These levels update when things change during backtesting so you can visualize your strategy and how it would perform as well as see if your percentage deviation is large enough to cover dips. When backtesting trades are taken, the chart will show where they were taken(in backtesting) along with info on those trades such as the number each order is, the size of that order and the percentage deviation that order is from the initial buy.
SENDING SIGNALS TO 3COMMAS
Tradingview cannot sync this backtester to 3Commas and with the way alerts are setup for strategies on Tradingview, the best option for you to give signals to your bot would be to use this backtester to figure out what trigger you want to use and then setup that indicator separately to send alerts to your bot. All of the indicators used for signals in this backtester are available for free and can be configured to match this backtester and send alerts to 3Commas for you. Just make sure you set your alerts to once per bar close and don’t use less than a 15 second timeframe because then you could trigger the Tradingview threshold for alerts and get your alerts shut off.
You can also use this backtester with your own buy triggers if you know a little pine script. Just make copy of the script and code in your own buy signals and see how it backtests.
INFO PANEL FOR ANALYZING YOUR STRATEGY
The right hand side of the screen will show an info panel that shows a lot of different information so you can quickly see your bot settings and how it performed right on the screen.
In the top right corner you will see in purple your bot settings. These include your stoploss % if turned on, take profit %, average down order %, average down order % multiplier, volume multiplier, max number of orders allowed and size of your base order.
The top section of the first column “Current Trade” shows these stats: the open trade’s average price, the open trade’s take profit price, the open trade’s PNL, how far price is from your open tarde’s take profit level in percentage, your open position size and number of open orders.
The bottom section of the first column “Overall Performance” shows these stats: total number of trades taken during backtesting range, the largest amount of trades that were open at one time during backtesting, the max drawdown, the average number of bars per trade, gross profit, net profit, percent profit from your initial capital, current portfolio value and your initial capital.
CUSTOMIZABLE OPTIONS TO FIND THE PERFECT STRATEGY
Stoploss On/Off
This will turn your stoploss on or off. By default it is set to off and will not affect anything unless turned on.
Stoploss Percentage
This is the percentage below your final average down order price that will be set as a stoploss to keep your account from going too far in the red on big dips.
Take Profit Percentage - This is the percentage of profit you want the trade to hit before taking profit on your entire DCA trade. This level updates everytime you average down.
Average Down Percentage - This is the percentage that price has to drop from your initial order to initiate your first safety order. If the Average Down Percent Multiplier is set to 1 then this percentage will be the same for every average down order.
Average Down Percentage Multiplier - This multiplies your Average Down Percentage so each safety order needs a larger percentage deviation than the previous one. This keeps your buys closer together at the beginning and further apart when you hit more orders so you can extend your trading range but still be aggressive when price is going sideways.
Volume Multiplier Per New Order - This multiplies the size of each trade based on your base order. If you set it to a 2x multiplier then each average down order will be 2 times the size of the last one. So for example, a $100 base order with a 2x multiplier would have these values for the first 3 average down orders: 200, 400, 800.
Size Of Base Order - This is the size of your first position entry and will be used as a starting point for the volume multiplier. If your base order is $100 then it will buy $100 worth of whatever crypto you are backtesting this on. If you are looking at stock charts, you need to make sure your base order is higher than the share price across the entire backtesting range or it will not perform correctly.
Max Number Of Orders - This is the maximum number of orders the bot can take, including your base order. Adjust this to suit the amount of capital you are willing to allocate to your bot based on how much money it will require to run according to your bot settings.
TIPS ON HOW TO USE FOR BEST RESULTS
If you don’t have a lot of capital to work with, then use longer timeframes with a reasonable take profit percentage so that you don’t need a lot of average down orders. You can also try keeping the volume multiplier close to 1.
You can use the 3Commas dca bot settings page to see how much capital you will need for your strategy if you match it to the settings you have on this indicator. You can also check to see how much of a percentage deviation your bot is covering to make sure you have a reasonable range to trade in and orders to cover big dips. You can also check your coverage by seeing how far down the chart the green lines cover, which are your average down orders.
Make sure the initial capital in the properties tab of the settings has enough to cover all of your orders otherwise you will get unrealistic backtesting results. Also, make sure you leave the order size in the properties tab on contracts so it calculates your trades correctly. The only settings you need to touch in the properties tab is the initial capital. Unless you are trading somewhere that has lower commission fees, then you can change that to match, but leave all the other settings as is for it to function properly.
Increasing the volume multiplier will make your average price and take profit target follow the price action a lot closer as price falls, but it can also lead to having very large orders very quickly once you get into the 1.5-3x multiple range. Try using a high volume multiplier with less safety orders and you will get better results, however you need to have money on the sidelines to add on major dips to keep your bot turning a profit. Be very careful with this as greed and impatience will hurt your overall performance. This bot is meant to make money with lots of small wins so don’t get greedy and make sure you have enough money to cover large dips. If you are being aggressive with your bot, then I recommend only using 25% or less of your portfolio to trade aggressively and then use the smart trade feature on 3commas to add chunks of funds to your trades when price dips below your last safety order. Or if you want it to run without any supervision, then use lower volume multipliers and have lots of safety orders that can cover entire bear markets and still keep buying lower.
It’s a good idea to have some capital on the sidelines that you can add in when price dips quickly. This will help lower your average price and allow your bot to get out in profit quicker. 3Commas bot has a smart trade feature that will allow you to track your average price when adding extra funds and it will automatically update your other orders which is very convenient. Look at the longer timeframes when price dips and only add chunks at major areas where price is very likely to bounce. Or you can be aggressive when trading and add to your position when price dips and is at a likely bounce zone to maximize profits.
Only trade coins that have a good amount of liquidity as the larger your orders get, the harder it will be to sell if there isn’t much liquidity. Also, beware of how large your first order is as it will usually be a market order and can move the market if there is not much liquidity.
Since this bot takes a lot of trades and performs best when taking small profits consistently, you will need to factor in exchange fees. The bot is set to .5% commission(you can change this) on the buy and sell orders as most exchanges charge that amount. Some exchanges offer no fee trading on certain coins so be sure to look around for those so you can keep the commissions and maximize profits.
I strongly encourage you to try out a lot of different setting combinations across multiple different coins and do it across a few months to see how it would have performed under various market conditions. This will help you get a better idea of how much of a percentage deviation you’ll need to be able to cover to keep your bot running and making constant profits. You can also use the deep backtesting feature of the strategy panel to see how it would have done, but just beware that the info panel of the indicator will not reflect deep backtesting results, only the normal backtesting range.
MARKETS
This backtester can be used on any market including crypto, stocks, forex & futures. You just need to make sure your base order is larger than the share price when using this on things besides crypto.
TIMEFRAMES
This backtester can be used on all timeframes.

Webhook Starter Kit [HullBuster]
Introduction
This is an open source strategy which provides a framework for webhook enabled projects. It is designed to work out-of-the-box on any instrument triggering on an intraday bar interval. This is a full featured script with an emphasis on actual trading at a brokerage through the TradingView alert mechanism and without requiring browser plugins.
The source code is written in a self documenting style with clearly defined sections. The sections “communicate” with each other through state variables making it easy for the strategy to evolve and improve. This is an excellent place for Pine Language beginners to start their strategy building journey. The script exhibits many Pine Language features which will certainly ad power to your script building abilities.
This script employs a basic trend follow strategy utilizing a forward pyramiding technique. Trend detection is implemented through the use of two higher time frame series. The market entry setup is a Simple Moving Average crossover. Positions exit by passing through conditional take profit logic. The script creates ten indicators including a Zscore oscillator to measure support and resistance levels. The indicator parameters are exposed through 47 strategy inputs segregated into seven sections. All of the inputs are equipped with detailed tool tips to help you get started.
To improve the transition from simulation to execution, strategy.entry and strategy.exit calls show enhanced message text with embedded keywords that are combined with the TradingView placeholders at alert time. Thereby, enabling a single JSON message to generate multiple execution events. This is genius stuff from the Pine Language development team. Really excellent work!
This document provides a sample alert message that can be applied to this script with relatively little modification. Without altering the code, the strategy inputs can alter the behavior to generate thousands of orders or simply a few dozen. It can be applied to crypto, stocks or forex instruments. A good way to look at this script is as a webhook lab that can aid in the development of your own endpoint processor, impress your co-workers and have hours of fun.
By no means is a webhook required or even necessary to benefit from this script. The setups, exits, trend detection, pyramids and DCA algorithms can be easily replaced with more sophisticated versions. The modular design of the script logic allows you to incrementally learn and advance this script into a functional trading system that you can be proud of.
Design
This is a trend following strategy that enters long above the trend line and short below. There are five trend lines that are visible by default but can be turned off in Section 7. Identified, in frequency order, as follows:
1. - EMA in the chart time frame. Intended to track price pressure. Configured in Section 3.
2. - ALMA in the higher time frame specified in Section 2 Signal Line Period.
3. - Linear Regression in the higher time frame specified in Section 2 Signal Line Period.
4. - Linear Regression in the higher time frame specified in Section 2 Signal Line Period.
5. - DEMA in the higher time frame specified in Section 2 Trend Line Period.
The Blue, Green and Orange lines are signal lines are on the same time frame. The time frame selected should be at least five times greater than the chart time frame. The Purple line represents the trend line for which prices above the line suggest a rising market and prices below a falling market. The time frame selected for the trend should be at least five times greater than the signal lines.
Three oscillators are created as follows:
1. Stochastic - In the chart time frame. Used to enter forward pyramids.
2. Stochastic - In the Trend period. Used to detect exit conditions.
3. Zscore - In the Signal period. Used to detect exit conditions.
The Stochastics are configured identically other than the time frame. The period is set in Section 2.
Two Simple Moving Averages provide the trade entry conditions in the form of a crossover. Crossing up is a long entry and down is a short. This is in fact the same setup you get when you select a basic strategy from the Pine editor. The crossovers are configured in Section 3. You can see where the crosses are occurring by enabling Show Entry Regions in Section 7.
The script has the capacity for pyramids and DCA. Forward pyramids are enabled by setting the Pyramid properties tab with a non zero value. In this case add on trades will enter the market on dips above the position open price. This process will continue until the trade exits. Downward pyramids are available in Crypto and Range mode only. In this case add on trades are placed below the entry price in the drawdown space until the stop is hit. To enable downward pyramids set the Pyramid Minimum Span In Section 1 to a non zero value.
This implementation of Dollar Cost Averaging (DCA) triggers off consecutive losses. Each loss in a run increments a sequence number. The position size is increased as a multiple of this sequence. When the position eventually closes at a profit the sequence is reset. DCA is enabled by setting the Maximum DCA Increments In Section 1 to a non zero value.
It should be noted that the pyramid and DCA features are implemented using a rudimentary design and as such do not perform with the precision of my invite only scripts. They are intended as a feature to stress test your webhook endpoint. As is, you will need to buttress the logic for it to be part of an automated trading system. It is for this reason that I did not apply a Martingale algorithm to this pyramid implementation. But, hey, it’s an open source script so there is plenty of room for learning and your own experimentation.
How does it work
The overall behavior of the script is governed by the Trading Mode selection in Section 1. It is the very first input so you should think about what behavior you intend for this strategy at the onset of the configuration. As previously discussed, this script is designed to be a trend follower. The trend being defined as where the purple line is predominately heading. In BiDir mode, SMA crossovers above the purple line will open long positions and crosses below the line will open short. If pyramiding is enabled add on trades will accumulate on dips above the entry price. The value applied to the Minimum Profit input in Section 1 establishes the threshold for a profitable exit. This is not a hard number exit. The conditional exit logic must be satisfied in order to permit the trade to close. This is where the effort put into the indicator calibration is realized. There are four ways the trade can exit at a profit:
1. Natural exit. When the blue line crosses the green line the trade will close. For a long position the blue line must cross under the green line (downward). For a short the blue must cross over the green (upward).
2. Alma / Linear Regression event. The distance the blue line is from the green and the relative speed the cross is experiencing determines this event. The activation thresholds are set in Section 6 and relies on the period and length set in Section 2. A long position will exit on an upward thrust which exceeds the activation threshold. A short will exit on a downward thrust.
3. Exponential event. The distance the yellow line is from the blue and the relative speed the cross is experiencing determines this event. The activation thresholds are set in Section 3 and relies on the period and length set in the same section.
4. Stochastic event. The purple line stochastic is used to measure overbought and over sold levels with regard to position exits. Signal line positions combined with a reading over 80 signals a long profit exit. Similarly, readings below 20 signal a short profit exit.
Another, optional, way to exit a position is by Bale Out. You can enable this feature in Section 1. This is a handy way to reduce the risk when carrying a large pyramid stack. Instead of waiting for the entire position to recover we exit early (bale out) as soon as the profit value has doubled.
There are lots of ways to implement a bale out but the method I used here provides a succinct example. Feel free to improve on it if you like. To see where the Bale Outs occur, enable Show Bale Outs in Section 7. Red labels are rendered below each exit point on the chart.
There are seven selectable Trading Modes available from the drop down in Section 1:
1. Long - Uses the strategy.risk.allow_entry_in to execute long only trades. You will still see shorts on the chart.
2. Short - Uses the strategy.risk.allow_entry_in to execute short only trades. You will still see long trades on the chart.
3. BiDir - This mode is for margin trading with a stop. If a long position was initiated above the trend line and the price has now fallen below the trend, the position will be reversed after the stop is hit. Forward pyramiding is available in this mode if you set the Pyramiding value in the Properties tab. DCA can also be activated.
4. Flip Flop - This is a bidirectional trading mode that automatically reverses on a trend line crossover. This is distinctively different from BiDir since you will get a reversal even without a stop which is advantageous in non-margin trading.
5. Crypto - This mode is for crypto trading where you are buying the coins outright. In this case you likely want to accumulate coins on a crash. Especially, when all the news outlets are talking about the end of Bitcoin and you see nice deep valleys on the chart. Certainly, under these conditions, the market will be well below the purple line. No margin so you can’t go short. Downward pyramids are enabled for Crypto mode when two conditions are met. First the Pyramiding value in the Properties tab must be non zero. Second the Pyramid Minimum Span in Section 1 must be non zero.
6. Range - This is a counter trend trading mode. Longs are entered below the purple trend line and shorts above. Useful when you want to test your webhook in a market where the trend line is bisecting the signal line series. Remember that this strategy is a trend follower. It’s going to get chopped out in a range bound market. By turning on the Range mode you will at least see profitable trades while stuck in the range. However, when the market eventually picks a direction, this mode will sustain losses. This range trading mode is a rudimentary implementation that will need a lot of improvement if you want to create a reliable switch hitter (trend/range combo).
7. No Trade. Useful when setting up the trend lines and the entry and exit is not important.
Once in the trade, long or short, the script tests the exit condition on every bar. If not a profitable exit then it checks if a pyramid is required. As mentioned earlier, the entry setups are quite primitive. Although they can easily be replaced by more sophisticated algorithms, what I really wanted to show is the diminished role of the position entry in the overall life of the trade. Professional traders spend much more time on the management of the trade beyond the market entry. While your trade entry is important, you can get in almost anywhere and still land a profitable exit.
If DCA is enabled, the size of the position will increase in response to consecutive losses. The number of times the position can increase is limited by the number set in Maximum DCA Increments of Section 1. Once the position breaks the losing streak the trade size will return the default quantity set in the Properties tab. It should be noted that the Initial Capital amount set in the Properties tab does not affect the simulation in the same way as a real account. In reality, running out of money will certainly halt trading. In fact, your account would be frozen long before the last penny was committed to a trade. On the other hand, TradingView will keep running the simulation until the current bar even if your funds have been technically depleted.
Entry and exit use the strategy.entry and strategy.exit calls respectfully. The alert_message parameter has special keywords that the endpoint expects to properly calculate position size and message sequence. The alert message will embed these keywords in the JSON object through the {{strategy.order.alert_message}} placeholder. You should use whatever keywords are expected from the endpoint you intend to webhook in to.
Webhook Integration
The TradingView alerts dialog provides a way to connect your script to an external system which could actually execute your trade. This is a fantastic feature that enables you to separate the data feed and technical analysis from the execution and reporting systems. Using this feature it is possible to create a fully automated trading system entirely on the cloud. Of course, there is some work to get it all going in a reliable fashion. Being a strategy type script place holders such as {{strategy.position_size}} can be embedded in the alert message text. There are more than 10 variables which can write internal script values into the message for delivery to the specified endpoint.
Entry and exit use the strategy.entry and strategy.exit calls respectfully. The alert_message parameter has special keywords that my endpoint expects to properly calculate position size and message sequence. The alert message will embed these keywords in the JSON object through the {{strategy.order.alert_message}} placeholder. You should use whatever keywords are expected from the endpoint you intend to webhook in to.
Here is an excerpt of the fields I use in my webhook signal:
"broker_id": "kraken",
"account_id": "XXX XXXX XXXX XXXX",
"symbol_id": "XMRUSD",
"action": "{{strategy.order.action}}",
"strategy": "{{strategy.order.id}}",
"lots": "{{strategy.order.contracts}}",
"price": "{{strategy.order.price}}",
"comment": "{{strategy.order.alert_message}}",
"timestamp": "{{time}}"
Though TradingView does a great job in dispatching your alert this feature does come with a few idiosyncrasies. Namely, a single transaction call in your script may cause multiple transmissions to the endpoint. If you are using placeholders each message describes part of the transaction sequence. A good example is closing a pyramid stack. Although the script makes a single strategy.close() call, the endpoint actually receives a close message for each pyramid trade. The broker, on the other hand, only requires a single close. The incongruity of this situation is exacerbated by the possibility of messages being received out of sequence. Depending on the type of order designated in the message, a close or a reversal. This could have a disastrous effect on your live account. This broker simulator has no idea what is actually going on at your real account. Its just doing the job of running the simulation and sending out the computed results. If your TradingView simulation falls out of alignment with the actual trading account lots of really bad things could happen. Like your script thinks your are currently long but the account is actually short. Reversals from this point forward will always be wrong with no one the wiser. Human intervention will be required to restore congruence. But how does anyone find out this is occurring? In closed systems engineering this is known as entropy. In practice your webhook logic should be robust enough to detect these conditions. Be generous with the placeholder usage and give the webhook code plenty of information to compare states. Both issuer and receiver. Don’t blindly commit incoming signals without verifying system integrity.
Setup
The following steps provide a very brief set of instructions that will get you started on your first configuration. After you’ve gone through the process a couple of times, you won’t need these anymore. It’s really a simple script after all. I have several example configurations that I used to create the performance charts shown. I can share them with you if you like. Of course, if you’ve modified the code then these steps are probably obsolete.
There are 47 inputs divided into seven sections. For the most part, the configuration process is designed to flow from top to bottom. Handy, tool tips are available on every field to help get you through the initial setup.
Step 1. Input the Base Currency and Order Size in the Properties tab. Set the Pyramiding value to zero.
Step 2. Select the Trading Mode you intend to test with from the drop down in Section 1. I usually select No Trade until I’ve setup all of the trend lines, profit and stop levels.
Step 3. Put in your Minimum Profit and Stop Loss in the first section. This is in pips or currency basis points (chart right side scale). Remember that the profit is taken as a conditional exit not a fixed limit. The actual profit taken will almost always be greater than the amount specified. The stop loss, on the other hand, is indeed a hard number which is executed by the TradingView broker simulator when the threshold is breached.
Step 4. Apply the appropriate value to the Tick Scalar field in Section 1. This value is used to remove the pipette from the price. You can enable the Summary Report in Section 7 to see the TradingView minimum tick size of the current chart.
Step 5. Apply the appropriate Price Normalizer value in Section 1. This value is used to normalize the instrument price for differential calculations. Basically, we want to increase the magnitude to significant digits to make the numbers more meaningful in comparisons. Though I have used many normalization techniques, I have always found this method to provide a simple and lightweight solution for less demanding applications. Most of the time the default value will be sufficient. The Tick Scalar and Price Normalizer value work together within a single calculation so changing either will affect all delta result values.
Step 6. Turn on the trend line plots in Section 7. Then configure Section 2. Try to get the plots to show you what’s really happening not what you want to happen. The most important is the purple trend line. Select an interval and length that seem to identify where prices tend to go during non-consolidation periods. Remember that a natural exit is when the blue crosses the green line.
Step 7. Enable Show Event Regions in Section 7. Then adjust Section 6. Blue background fills are spikes and red fills are plunging prices. These measurements should be hard to come by so you should see relatively few fills on the chart if you’ve set this up as intended. Section 6 includes the Zscore oscillator the state of which combines with the signal lines to detect statistically significant price movement. The Zscore is a zero based calculation with positive and negative magnitude readings. You want to input a reasonably large number slightly below the maximum amplitude seen on the chart. Both rise and fall inputs are entered as a positive real number. You can easily use my code to create a separate indicator if you want to see it in action. The default value is sufficient for most configurations.
Step 8. Turn off Show Event Regions and enable Show Entry Regions in Section 7. Then adjust Section 3. This section contains two parts. The entry setup crossovers and EMA events. Adjust the crossovers first. That is the Fast Cross Length and Slow Cross Length. The frequency of your trades will be shown as blue and red fills. There should be a lot. Then turn off Show Event Regions and enable Display EMA Peaks. Adjust all the fields that have the word EMA. This is actually the yellow line on the chart. The blue and red fills should show much less than the crossovers but more than event fills shown in Step 7.
Step 9. Change the Trading Mode to BiDir if you selected No Trades previously. Look on the chart and see where the trades are occurring. Make adjustments to the Minimum Profit and Stop Offset in Section 1 if necessary. Wider profits and stops reduce the trade frequency.
Step 10. Go to Section 4 and 5 and make fine tuning adjustments to the long and short side.
Example Settings
To reproduce the performance shown on the chart please use the following configuration: (Bitcoin on the Kraken exchange)
1. Select XBTUSD Kraken as the chart symbol.
2. On the properties tab set the Order Size to: 0.01 Bitcoin
3. On the properties tab set the Pyramiding to: 12
4. In Section 1: Select “Crypto” for the Trading Model
5. In Section 1: Input 2000 for the Minimum Profit
6. In Section 1: Input 0 for the Stop Offset (No Stop)
7. In Section 1: Input 10 for the Tick Scalar
8. In Section 1: Input 1000 for the Price Normalizer
9. In Section 1: Input 2000 for the Pyramid Minimum Span
10. In Section 1: Check mark the Position Bale Out
11. In Section 2: Input 60 for the Signal Line Period
12. In Section 2: Input 1440 for the Trend Line Period
13. In Section 2: Input 5 for the Fast Alma Length
14. In Section 2: Input 22 for the Fast LinReg Length
15. In Section 2: Input 100 for the Slow LinReg Length
16. In Section 2: Input 90 for the Trend Line Length
17. In Section 2: Input 14 Stochastic Length
18. In Section 3: Input 9 Fast Cross Length
19. In Section 3: Input 24 Slow Cross Length
20. In Section 3: Input 8 Fast EMA Length
21. In Section 3: Input 10 Fast EMA Rise NetChg
22. In Section 3: Input 1 Fast EMA Rise ROC
23. In Section 3: Input 10 Fast EMA Fall NetChg
24. In Section 3: Input 1 Fast EMA Fall ROC
25. In Section 4: Check mark the Long Natural Exit
26. In Section 4: Check mark the Long Signal Exit
27. In Section 4: Check mark the Long Price Event Exit
28. In Section 4: Check mark the Long Stochastic Exit
29. In Section 5: Check mark the Short Natural Exit
30. In Section 5: Check mark the Short Signal Exit
31. In Section 5: Check mark the Short Price Event Exit
32. In Section 5: Check mark the Short Stochastic Exit
33. In Section 6: Input 120 Rise Event NetChg
34. In Section 6: Input 1 Rise Event ROC
35. In Section 6: Input 5 Min Above Zero ZScore
36. In Section 6: Input 120 Fall Event NetChg
37. In Section 6: Input 1 Fall Event ROC
38. In Section 6: Input 5 Min Below Zero ZScore
In this configuration we are trading in long only mode and have enabled downward pyramiding. The purple trend line is based on the day (1440) period. The length is set at 90 days so it’s going to take a while for the trend line to alter course should this symbol decide to node dive for a prolonged amount of time. Your trades will still go long under those circumstances. Since downward accumulation is enabled, your position size will grow on the way down.
The performance example is Bitcoin so we assume the trader is buying coins outright. That being the case we don’t need a stop since we will never receive a margin call. New buy signals will be generated when the price exceeds the magnitude and speed defined by the Event Net Change and Rate of Change.
Feel free to PM me with any questions related to this script. Thank you and happy trading!
CFTC RULE 4.41
These results are based on simulated or hypothetical performance results that have certain inherent limitations. Unlike the results shown in an actual performance record, these results do not represent actual trading. Also, because these trades have not actually been executed, these results may have under-or over-compensated for the impact, if any, of certain market factors, such as lack of liquidity. Simulated or hypothetical trading programs in general are also subject to the fact that they are designed with the benefit of hindsight. No representation is being made that any account will or is likely to achieve profits or losses similar to these being shown.

POW EdgeHello fellow Trading View member,
Eventually our rebranded update with some extra features for our exclusive 'Edge' Strategy Script.
In this description I will run through;
The strategy itself, what is it?
What does it do?
How does it work?
How can it help you?
How good is it?
What is it.....
The Edge Strategy itself is based upon 5 indicators lining up in total confluence to enter a position in line with a trending move. Adding them together adds more confluence and probability to each individual trade outcome over the longer term. The individual strategies used are based on Trend strategies all used in combination.
The uniqueness to this is how they are combined. Indicators can work to a point individually of course, but combining them together and only trading when all are in a line was our concept, whilst reviewing how each individual indicator can be optimised to work with the others.
Also the motivation was to be the right side of the market in a trending move and capitalising on as much as that move as possible.
The first part is to ensure the candle close is above or below our moving average, we can then check the state and validity of each of the other 4 indicators. Once this confluence is in alignment a trade is valid for entry - this has to be valid at the same time - but not all valid on the same candle - they will come into alignment in different stages. But once they are, our trade is valid.
I will not reveal the other individual 3 indicators but the other is also an ADX function to add a threshold into the strategy to identify a trend - usually above 20/25. This has upsides and downsides as any user can visualise and see in the testing.
We also add to the script to look for a Buy then Sell, Sell then Buy - we found this had more profitable results overall and next phase was to review the money management; where and how we placed our SL and when and why we exited the trade.
Example - for a BUY trade to be valid, all 5 indictors must meet their own criteria before a BUY is printed on the chart. Absolutely no technical analysis is needed to trade this strategy and the data we have is based on using the strategy in isolation - how you wish to use this either independently or supporting your own trading is of course, up to you.
The SL and TP's are based on ATR Multipliers thus ensuring we are factoring in market volatility at that time. We also have a FT (Follow Trend) option, which is a worthy addition for capitalising on big trending moves.
This strategy will work on all markets and timeframes.
We understand and accept that all pairs and markets are different thus we have optimised certain pairs and timeframes with different parameters to provide increased returns, these are hard coded (H1 Timeframe) and also provided for your review.
Profitability is easily viewable in the ‘Strategy Tester’ - this is a great tool. This is where you can see historic / live data for the strategy.
Data like;
The Net Profit
Number of trades
Win Percentage
Every trade taken
Average Win
Average Loss
Maximal DD , etc.
We have individually optimised each pair to ensure this is the case and hard coded these parameters into the strategy. All you need to do is flick between the pairs - the strategy will then identify the pair you are on and change the parameters to suit in the background.
Whilst a trade is open, the strategy will convert all candles to the relevant colour - Green for an uptrend and Red for a downtrend (all customisable).
We find this is helpful for traders psychology - not getting 'spooked' by other candle colours, affecting your decision making.
When a new signal is valid, 'POW BUY' or 'POW SELL' will be displayed on the first candle open for entry. As well as this, you will also have the trade label print which will display the following;
- EP – Entry price
- SL – Stop loss
- TP – Take Profit
- Lot size
The trade information printed will also tell you the pip values of your stop loss and take profit based on how far away they are from the trade entry price.
The lot size printed is customisable and unique to your account- within the strategy settings you can simply input your account balance, currency and risk approach which includes a fixed risk amount, fixed lot size or a fixed percentage.
This removes the need for 3rd party apps or websites to quickly calculate your specific risk on your trade. Thus saving you time and making sure you aren't 'guessing' with your lot size.
No one likes losing more than they thought.
The progress and initial challenges....
To start, our first version simply showed the buy and sell arrows when a trade was valid. However, this caused subjectivity with where we would place our stop loss and how we would manage the exit of the trade once we were in it. So, we identified a solid strategy for this was incorporating the Average True Range (ATR) for SL and TP options.
I was especially keen to add the SL and exit management so I could obtain solid back testing data to support my thoughts that 'this works'. Every trader requires confidence and belief in their strategy, without it you simply won't succeed or be disciplined in your execution.
The other challenge we all face is calculating the lot sizes of our trades right? So, it was important that we incorporated a lot size calculator - its all about making it easy when a trade is valid to enter without trying to calculate this accurately.
Lastly, when pairs are stuck in a range - this can be a testing period of 'chop' for a trend strategy, so we also incorporated the ADX function to enable us to set a threshold level to identify when the instrument is more likely to be trending.
What does it do?
Ultimately, tells you when to buy and sell - where to place your SL and when to exit. Whilst also ensuring your risk management is on point, by displaying your trading lot size. Also providing you with live back tested data at your finger tips thank you to the strategy tester.
How does it work?
This will be visible on your trading view charts once you get access. And will work across all your devices, the trading view website or the app on your phone for example.
You can also use Trading View alerts, so you won't miss a trade and can go about your day as normal without watching the screen. This will work on the Free version of TV, however, in order to benefit from more alerts and templates it makes sense to upgrade to a higher package.
How can it help you?
This will help give you a mechanical approach to your trading. This means, less decision making on your part, with the instant benefit of seeing the data you have at your fingertips thanks to the 'Strategy Tester' TV Function.
It will save you time, you don't need to be in front of your screen or completing any subjective analysis.
Integrated lot size calculator can ensure you are always accurate with your risk - either in percentage or a fixed amount of risk - whichever you prefer.
Understand Probability - this is the key one for me. Losing runs happen in any trading strategy. The great benefit here, is you can see them. How long were the losing runs? How can I prepare and plan my risk management around them are all fundamental keys to managing your emotions and being detached from your trades. No one wants to feel stressed or anxious when trading.
Customisable exit strategies - A specific TP for a 1:1 RR or 1:10 RR for example can be adjusted and you can see instantly how this affects the profitability.
The exit strategy options are shown below;
TP 1/2/3
FT - Follow Trend (no stop loss and follow's from Buys to Sells, Sell to Buy, etc.
SL + FT - SL present, but trade is held until a reverse signal is presented.
How good is it?
We have some really positive back testing data across a range of pairs and markets - equities and indices too.
Drop me a DM to see these and I'll be happy to share.
Below let me show you a screen shot of how this can work for you.
How do you access this?
Please visit our website for signup / purchase information in the first instance (the link is on our trading view signature) or send us a private message on here - its impossible to keep track of comments on our posts so to ensure we don't miss you, a private DM will be great please.
The Back test shown on this example is based on the Trading View mid price and also a realistic starting Capital of £10,000. This test result is also based on a 0.1% risk per trade, with a 5 tick spread and a commission of
Regards
Darren
Disclaimer alert.
Please remember past performance is exactly that - how our strategy performed over those dates tested, it is not obviously a guarantee of future performance. Most of our H1 data is valid from Jan 2017 to now - so 4+ years and data on 650+ trades per pair.

BKN: Thick Cut StrategyThick Cut is the juiciest BKN yet. This indicator is created to take a profitable trading strategy and turn it into an automated system. We've built in several pieces that professional traders use every day and turned it into an algo that produces on timeframes as low as 1, 3, and 5 minutes!
Limit Order Entries: When criteria is met, an alert is signaled that will send a value to enter a position at a limit price.
Built in Stop Loss: A stop is built in and the value can be sent to your bot using the {{plot}} function or you can rely on a TradingView alert when the stop is hit.
Built in Take Profits: We've built in two separate take profits and the ability to move your stop loss to breakeven after the first take profit is hit. Even if you take 50% profit at 1R and move your stop loss, you already have a profitable trade. Test results show 50% profits at 2R and the remainder at higher returns result in exceptional results.
Position Sizing: We've built in a position size based on your own predetermined risk. Want to risk $100 per trade? Great, put in 100 in the inputs and reference a quantity of {{plot("Position Size")}} in your alert to send a position size to the bot. You can also reference {{plot("Partial Close")}} to pull 50% of the position size closing 50% at TP1 and 50% at TP2.
Backtest results shown are very short term since we are viewing a 15m chart. This can be a profitable strategy on many timeframes, but lower timeframes will maximize results.
A unique script with incredible results. Further forward testing is live.
***IMPORTANT***
For access, please do not comment below. Comments here will not be replied to. Please send a DM here or on my linked Twitter. At this time, this strategy is considered a Beta release as we continue to fine tune settings and more. Expecting 2 weeks of beta with official release around June 6.

Profit-sync with Trexen StratThere are various scripts and indicators on Tradingview, but not many of them combine theories to improve the profitability of an indicator using settings from multiple time frames.
This script takes the Average True Range trailing exit idea to enter trades. Many other ideas have been tested to filter entry signals which may be weak or not profitable such as a second ATR with Higher TF, MFI/VFI, RSI , Momentum wavetrend, Weis Wave, MACD , Stochastic etc, but I felt the following works best:
- Over the ATR entries there is a directional filter very similar to Renko candles which can be set to a higher time frame, I use 4 hour with 15 min candles for example, this will only allow 15 min buy signals to execute if the 4 hour is also on the buy side.
- There is also a Trend directional filter which can be set to a higher/lower time frame, currently I am using this on allow setting to allow more trades
The higher both filter are, the more accurate the trades will be, but less frequent. The filters convert entry signals into exit signal which can be used as take profit point with alerts if there is a position open.
The overall theory is to follow trend and to exit with profit. I have tested different take profit alerts but think it’s better to either catch a whole price move or sell with a set trailing limit order at like 0.4/0.5%.
As I am trading BTC with a bot and not with TA I think it is good to get in on a trend reversal, follow the trend up and get out quick with profit. There is a lot of manipulation with crypto so things like Momentum indicators and money-flow may not represent what is actually happening in the market.

Trend Scalping Strategy - ForexHi all,
I have created the attached strategy for my own use primarily but thought I would share it as my experience to date is that it is profitable in particular circumstances, so thought I would open this out to the community to see if it can be successfully applied on any other pairs and timeframes.
I have protected the source code at this time - mainly because it needs massive tidying up! If I ever get time to do this then I will
The concept of the strategy is based upon the slingshot method - the strategy fundamentally does the following:
- Tests each candle for a new short term trend based upon EMAs
- If there is a new trend, check the RSI and ensure it isnt above the upper RSI threshold (for long positions) and below the lower RSI threshold (for short positions)
- If it passes the RSI check, entry is valid and draws a bar on the chart to show the opening entry position, stop loss position, take profit 1 and take profit 2 positions.
I have backtested this across 28 pairs on the M15 timeframe, comprising of a total of 140,000 candles (35,000 hours of trading). Across this period, 18 of the 28 pairs I looked at were profitable, with overall significant profit if live traded across the 28.
I have live tested 5 pairs on the same timeframe:
- GBPJPY
- GBPUSD
- GBPEUR
- CADJPY
- EURJPY
These pairs have to date given a rough ROR (Return on Risk) position of approx 60% average per trade.
All of the above has been done with the following inputs:
- RSI Upper - 68
- RSI Lower - 32
- Stop Loss - 0.0015
- TP1 - 0.002
- TP2 - 0.004
The SL and TPs are based on a decimal entry of a percentage movement - i.e. the Stop loss above reflects a 0.15% movement, etc etc. Obviously if this were to be tested on longer time frames it is likely that these would need to be larger figures.
I have also tested this live with great success on the S&P 500 and the FTSE, with the following settings:
Indicator Timeframe TP1 TP2 SL Upper Lower
FTSE M5 0.0015 0.004 0.001 70 30
SPX M5 0.0015 0.004 0.001 75 35
Three key notes on trading this below - THESE ARE VERY IMPORTANT!
- This is NOT a high strike rate strategy. Strike rate on profitable pairs is between approx 45 and 55% (although I have seen as low as 35% and still seen significant profit). This has two natural conclusions - risk management is VITAL (I risk 0.5% on each trade, but this may in fact be high for this strategy), and be prepared for potentially significant drawdowns. I have seen certainly drawdowns of 20 consecutive losing trades (counting TP1 and TP2 as 2 trades) and probably longer, which obviously means drawdowns of 10% or greater. The other thing to bear in mind is that with this kind of strike rate, you shouldnt be setting TP1 at a 1:1 risk reward or lower.
- Take Profit 1 is easy - straight Stop and Limit orders. Take Profit 2 is a trailing stop with a start point of the limit for TP1, with then a trailing stop of this distance. This means that should you win on TP1, TP2 is a risk free trade but also trails in for profit if TP2 isnt reached (which it normally isnt). DO NOT set TP2 as a standard stop and limit, this rapidly makes this strategy unprofitable. The point here is that if you reach TP1 you are in some form of trend where you want to capture as much profit as you can.
- Do not enter a trade mid candle. The strategy is based upon the close of the trending candle not the "live" price during this candle, so no need to rush into a trade. If you enter mid candle you will find more often than not that the indicator wasnt for a valid trade by the candle close.
Also, standard disclaimer - past performance is no guarantee of future performance, and if you choose to use this strategy/indicator you do so 100% at your own risk. As a minimum, pick your pairs carefully - I have found particular unprofitability with this strategy with the AUD and NZD pairs so I have ruled these out completely at present, although with different timeframes and inputs these may of course be profitable.
I hope this is helpful for someone...I'd welcome any feedback or other setups where this is profitable.
Moving forward, I want to do some more work on this strategy to rule out some of the more negative trades, and I primarily intend to do this using pivots - however this will be an as and when I get chance.
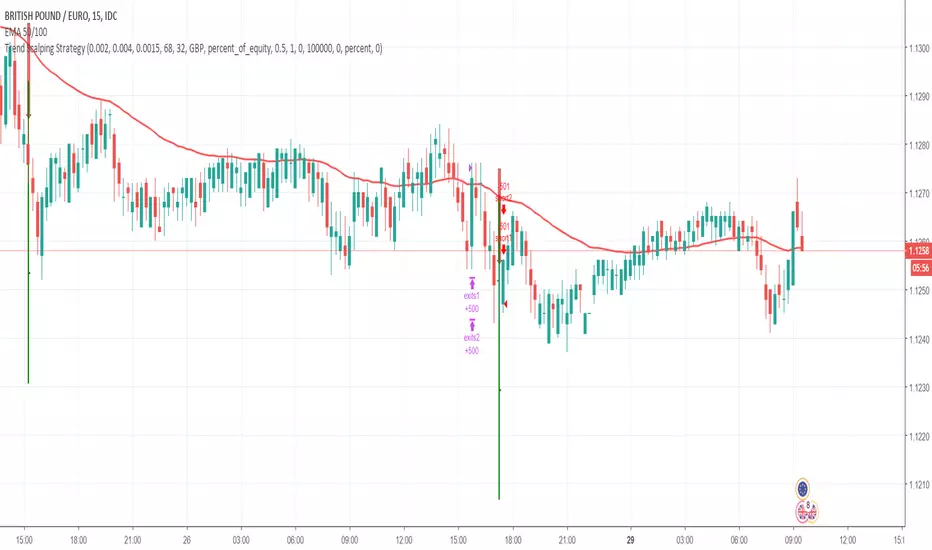
Hanzo Strategy - Volume & Smart Money📊 HANZO STRATEGY - Complete Description
## 🎯 Strategy Overview
The **Hanzo Strategy** is an advanced institutional trading system that combines Volume Profile analysis, Smart Money Concepts, and Price Action patterns to identify high-probability trade setups. This strategy is specifically designed for trading Gold (XAUUSD), NAS100, and US30 on the 15-minute timeframe.
---
## 🧠 Core Trading Philosophy
The Hanzo Strategy operates on the principle that **institutional money leaves footprints** in the market through:
- Volume accumulation at key price levels
- Liquidity sweeps and stop hunts
- Order block formations
- Strategic wick rejections at support/resistance
By identifying these institutional behaviors and combining them with precise volume analysis, the strategy aims to trade **with** the smart money, not against it.
---
## 🔑 Key Components
### 1️⃣ **Fixed Range Volume Profile (FRVP)**
- **What it does:** Analyzes the last 2 days of price action and calculates where the most volume traded
- **Point of Control (POC):** The price level with the highest trading volume - acts as a magnet for price
- **How we use it:** Price tends to revert to POC. When price is far from POC and starts moving toward it, we prepare for entries
- **Visual:** Yellow cross line on the chart marking the POC
### 2️⃣ **Wick Cluster Detection**
- **What it does:** Automatically identifies price levels where multiple candle wicks have rejected (2-6+ wicks)
- **Why it matters:** Multiple rejections at the same level indicate strong institutional support/resistance
- **Upper wick clusters:** Resistance zones where price was rejected downward
- **Lower wick clusters:** Support zones where price was rejected upward
- **Visual:** Dashed lines (red for resistance, green for support)
### 3️⃣ **Session Volatility Boxes**
- **London Session (8:00-16:00 UTC+3):** Captures European market volatility range
- **New York Session (13:30-20:00 UTC+3):** Captures US market volatility range
- **How we use it:** These ranges often act as support/resistance for the rest of the day
- **Visual:** Blue box for London, Orange box for New York
### 4️⃣ **Smart Money Zones**
**Order Blocks:**
- Strong institutional areas where banks and hedge funds placed large orders
- **Bullish Order Block:** Area where smart money bought heavily before a strong upward move
- **Bearish Order Block:** Area where smart money sold heavily before a strong downward move
- **Visual:** Green/Red filled boxes with "Bull OB" or "Bear OB" labels
**Liquidity Sweeps:**
- Price breaks above recent high or below recent low, then quickly reverses
- This is a "stop hunt" - institutions triggering retail stops before moving in the real direction
- **Bullish Sweep:** Price dips below support, grabs stops, then reverses up
- **Bearish Sweep:** Price pops above resistance, grabs stops, then reverses down
- **Visual:** Triangle markers (green up = bullish, red down = bearish)
### 5️⃣ **Engulfing Pattern Recognition**
- **Bullish Engulfing:** Large green candle fully engulfs the previous red candle - shows strong buying pressure
- **Bearish Engulfing:** Large red candle fully engulfs the previous green candle - shows strong selling pressure
- **How we use it:** Confirmation signal when combined with other factors
- **Visual:** Small circles below/above candles
### 6️⃣ **Trend Bias Indicator**
- Dynamically calculates market bias based on price position relative to POC
- **Bullish:** Price > 0.2% above POC
- **Neutral:** Price within 0.2% of POC
- **Bearish:** Price > 0.2% below POC
- **Visual:** Label at top of chart showing current bias
---
## 📈 Entry Signal Logic
The strategy generates **LONG** and **SHORT** signals based on confluence of multiple factors:
### 🟢 LONG ENTRY CONDITIONS:
1. **POC Break:** Price crosses above POC from below + Trend Bias is Bullish
**OR**
2. **Support Bounce:** Price touches a lower wick cluster + Bullish Engulfing pattern forms
3. **Additional Filter:** Trend Bias must NOT be Bearish
### 🔴 SHORT ENTRY CONDITIONS:
1. **POC Break:** Price crosses below POC from above + Trend Bias is Bearish
**OR**
2. **Resistance Rejection:** Price touches an upper wick cluster + Bearish Engulfing pattern forms
3. **Additional Filter:** Trend Bias must NOT be Bullish
---
## 🎯 Risk Management
### Stop Loss:
- **Calculation:** 2 × ATR(14) from entry price
- **Logic:** Uses Average True Range to adapt to current market volatility
- **Example:** If ATR = 10 points, stop loss is 20 points away
### Take Profit:
- **Calculation:** 3 × ATR(14) from entry price
- **Risk:Reward Ratio:** 1:1.5 (risking 2 ATR to make 3 ATR)
- **Example:** If ATR = 10 points, take profit is 30 points away
### Position Sizing:
- **Default:** 2% of account equity per trade
- **Adjustable:** Can be modified in strategy settings
---
## ⚙️ Strategy Settings & Customization
### Volume Profile Settings:
- **Lookback Days:** How many days to analyze (default: 2)
- **Profile Rows:** Resolution of volume calculation (default: 24)
- **POC Distance Threshold:** Minimum distance from POC for "far from POC" status (default: 0.3%)
### Wick Cluster Settings:
- **Min Wicks for Cluster:** How many wicks needed to form a cluster (default: 3)
- **Lookback Bars:** How far back to search for wicks (default: 50)
- **Tolerance %:** How close wicks must be to cluster together (default: 0.15%)
### Session Settings:
- **London Session:** 08:00-16:00 (adjustable)
- **New York Session:** 13:30-20:00 (adjustable)
- **UTC Offset:** Timezone adjustment (default: +3)
### Smart Money Settings:
- **Order Block Lookback:** How far back to search for order blocks (default: 20)
- **Toggle On/Off:** Can enable/disable order blocks and liquidity sweeps independently
---
## 📊 Performance Metrics Display
The strategy includes a real-time **Information Table** (top-right corner) showing:
| Metric | Description |
|--------|-------------|
| **Trend Bias** | Current market direction (Bullish/Neutral/Bearish) |
| **POC Price** | Current Point of Control price level |
| **Distance from POC** | How far current price is from POC (%) |
| **ATR (14)** | Current volatility measurement |
| **High Wick Clusters** | Number of resistance clusters detected |
| **Low Wick Clusters** | Number of support clusters detected |
| **Current Signal** | Active signal (LONG/SHORT/None) |
---
## 🚨 Alert System
The strategy can send alerts for:
1. **LONG Signal Triggered** - When all conditions met for long entry
2. **SHORT Signal Triggered** - When all conditions met for short entry
3. **Price Touching Support Cluster** - Warning that price at key support
4. **Price Touching Resistance Cluster** - Warning that price at key resistance
**Alert Frequency:** Once per bar (prevents spam)
---
## 📅 Best Trading Timeframes & Instruments
### ✅ Recommended Timeframes:
- **Primary Entry:** 15-minute chart
- **Trend Confirmation:** 30-minute or 1-hour chart
- **Higher Timeframe Filter:** 4-hour for major trend direction
### ✅ Recommended Instruments:
1. **Gold (XAUUSD)** - High volatility, respects key levels well
2. **NAS100 (US Tech 100)** - Strong trends, good liquidity
3. **US30 (Dow Jones)** - Reliable institutional participation
4. **EUR/USD, GBP/USD** - Can work on major forex pairs with adjustments
### ⏰ Best Trading Sessions:
- **London Open (08:00-12:00 UTC+3)** - High volatility, clear directional moves
- **New York Open (13:30-17:00 UTC+3)** - Strongest moves, highest volume
- **Overlap (13:30-16:00 UTC+3)** - Best liquidity and movement
### ⚠️ Avoid Trading:
- Asian session (low volatility)
- Major news events (first 15 minutes after high-impact news)
- Sundays and holidays (low liquidity)
---
## 💡 Pro Trading Tips
### 1. **Multiple Timeframe Confirmation**
- Check 1-hour chart for overall trend before taking 15-minute signals
- Only take LONG signals if 1-hour is bullish
- Only take SHORT signals if 1-hour is bearish
### 2. **POC Strategy**
- Best entries occur when price returns to POC after being far away
- Wait for POC touch + confirmation pattern (engulfing, order block)
- POC acts as support in uptrends, resistance in downtrends
### 3. **Wick Cluster Strategy**
- Strongest signals occur when wick clusters align with POC
- Look for 4+ wicks at the same level for highest probability
- Recent clusters (formed in last 2 days) are stronger than old ones
### 4. **Order Block Strategy**
- Fresh order blocks (just formed) are more powerful
- Wait for price to return to order block zone before entering
- Best when order block + wick cluster occur at same level
### 5. **London/NY Box Strategy**
- If price breaks above session high → look for LONG pullback entries
- If price breaks below session low → look for SHORT pullback entries
- Price often returns to session mid-point before continuing
### 6. **Risk Management Rules**
- **Never risk more than 2% per trade**
- **Don't trade more than 3 positions simultaneously**
- **If 2 losses in a row, reduce size to 1% or stop for the day**
- **Move stop to breakeven after 1:1 profit reached**
### 7. **High-Probability Setups**
Look for **CONFLUENCE** - the more factors aligned, the better:
✅ **BEST LONG SETUP:**
- Price at lower wick cluster (support)
- Price at/near POC
- Bullish order block present
- Bullish engulfing pattern forms
- Trend Bias = Bullish
- 1-hour chart = uptrend
✅ **BEST SHORT SETUP:**
- Price at upper wick cluster (resistance)
- Price at/near POC
- Bearish order block present
- Bearish engulfing pattern forms
- Trend Bias = Bearish
- 1-hour chart = downtrend
---
## 📈 Performance Expectations
### Typical Win Rate:
- **Conservative Trading (high confluence only):** 55-65% win rate
- **Moderate Trading (good setups):** 45-55% win rate
- **Aggressive Trading (all signals):** 35-45% win rate
### Typical Risk:Reward:
- **Average R:R:** 1:1.5 (with 2 ATR stop and 3 ATR target)
- **Breakeven adjusted:** Often improves to 1:2+ when stop moved to BE
### Monthly Trade Frequency (15M chart):
- **Gold:** 60-100 signals per month
- **NAS100:** 50-80 signals per month
- **US30:** 40-70 signals per month
---
## 🎓 Strategy Philosophy Summary
The Hanzo Strategy is built on three core principles:
1. **Follow the Volume** - Trade where institutions are active
2. **Respect the Levels** - Key support/resistance zones matter
3. **Confirm with Price Action** - Wait for confirmation before entering
This is NOT a holy grail - it requires:
- ✅ Discipline to wait for proper setups
- ✅ Patience to let trades play out
- ✅ Risk management to protect capital
- ✅ Emotional control to handle losses
---
## 🛠️ How to Use This Strategy
### Step 1: Initial Setup
1. Add strategy to 15-minute chart
2. Check that all components are visible (POC, clusters, boxes, etc.)
3. Adjust colors if needed for your chart theme
### Step 2: Daily Routine
1. **Pre-Market (before 8:00 AM):**
- Check POC location
- Note wick clusters from previous days
- Mark London/NY session boxes from yesterday
2. **London Session (8:00-16:00):**
- Watch for POC interactions
- Monitor for order blocks forming
- Wait for confluence setups
3. **NY Session (13:30-20:00):**
- Highest activity period
- Best signal quality
- More aggressive entries allowed
### Step 3: Trade Execution
1. Wait for signal label (LONG or SHORT) to appear
2. Check confluence factors (minimum 3)
3. Enter immediately or on next candle
4. Set stop loss at 2 × ATR from entry
5. Set take profit at 3 × ATR from entry
6. Move stop to breakeven at +1.5 ATR profit
### Step 4: Trade Management
- **Don't move stop closer** (let trade breathe)
- **Can trail stop** after 2:1 profit reached
- **Can take partial profits** at 1.5:1 and let rest run
- **Journal every trade** for future improvement
---
## ⚠️ Important Disclaimers
1. **Past performance does not guarantee future results**
2. **This strategy involves risk** - only trade with money you can afford to lose
3. **Backtest thoroughly** on your specific instruments before live trading
4. **Start small** - test with minimum position sizes first
5. **Market conditions change** - what works today may not work tomorrow
6. **Use proper risk management** - this is the #1 key to long-term success
---
## 🎯 Quick Reference Checklist
Before taking any trade, ask yourself:
- ✅ Is there a clear LONG or SHORT signal?
- ✅ Are we in London or NY session?
- ✅ Is price at/near POC or wick cluster?
- ✅ Is trend bias aligned with my direction?
- ✅ Is there an order block or engulfing pattern?
- ✅ Is my risk:reward at least 1:1.5?
- ✅ Am I risking no more than 2% of my account?
**If 5+ are YES → Take the trade!**
**If 3 or fewer YES → Skip and wait for better setup!**
---
## 🚀 Final Words
The Hanzo Strategy is a professional-grade trading system that combines institutional analysis with precise technical execution. Success comes not from taking every signal, but from taking only the **highest probability setups** with proper risk management.
**Trade smart. Trade safe. Trade like an institution.**
📊 **Good luck and profitable trading!** 📊

EMA 12-26-100 Momentum Strategy# Triple EMA Multi-Signal Momentum Strategy
## 📊 Overview
**Triple EMA Multi-Signal** is a comprehensive trend-following momentum strategy designed specifically for cryptocurrency markets. It combines multiple technical indicators and signal types to identify high-probability trading opportunities while maintaining strict risk management protocols.
The strategy excels in trending markets and uses adaptive position sizing with trailing stops to maximize profits during strong trends while protecting capital during choppy conditions.
## 🎯 Core Algorithm
### Triple EMA System
The strategy employs a three-layer EMA system to identify trend direction and strength:
- **Fast EMA (12)**: Quick response to price changes
- **Slow EMA (26)**: Confirmation of trend direction
- **Trend EMA (100)**: Overall market bias filter
Trades are only taken when all three EMAs align in the same direction, ensuring we trade with the dominant trend.
### Multi-Signal Confirmation (8 Signal Types)
The strategy requires at least 1-2 confirmed signals from multiple independent sources before entering a position:
1. **EMA Crossover** - Fast EMA crossing Slow EMA (primary signal)
2. **MACD Cross** - MACD line crossing signal line (momentum confirmation)
3. **RSI Reversal** - RSI bouncing from oversold/overbought zones
4. **Price Action** - Strong bullish/bearish candles (>60% of range)
5. **Volume Spike** - Above-average volume confirmation
6. **Breakout** - Price breaking 20-period high/low with volume
7. **Pullback to EMA** - Trend continuation after healthy retracement
8. **Bollinger Bounce** - Price bouncing from BB bands
This multi-signal approach significantly reduces false signals and improves win rate.
## 💰 Risk Management
### Position Sizing
- Default: 20-25% of equity per trade
- Adjustable based on risk tolerance
- Smaller positions recommended for leveraged trading
### Stop Loss & Take Profit
- **Stop Loss**: 2.0% (tight control of risk)
- **Take Profit**: 5.5% (2.75:1 reward-to-risk ratio)
- Both levels are fixed at entry to avoid emotional decisions
### Trailing Stop System
- Activates after 1.8% profit
- Trails at 1.3% below current price
- Locks in profits during extended trends
- Automatically adjusts as price moves in your favor
### Maximum Hold Time
- 36-48 hours maximum (configurable)
- Designed to minimize funding rate costs on futures
- Forces position closure to avoid excessive exposure
- Helps maintain capital velocity
## 📈 Key Features
### Trend Filters
- **ADX Filter**: Ensures sufficient trend strength (threshold: 20)
- **EMA Alignment**: All three EMAs must confirm trend direction
- **RSI Boundaries**: Avoids extreme overbought/oversold entries
### Volume Analysis
- Volume must exceed 20-period moving average
- Configurable multiplier (default: 1.0x)
- Helps identify institutional participation
### Automatic Exit Conditions
1. Take Profit target reached
2. Stop Loss triggered
3. Trailing stop activated
4. Trend reversal (EMA cross in opposite direction)
5. Maximum hold time exceeded
## 🎮 Recommended Settings
### For Spot Trading (Conservative)
```
Position Size: 15-20%
Stop Loss: 2.5%
Take Profit: 6.0%
Max Hold: 72 hours
Leverage: 1x
```
### For Futures 3-5x Leverage (Balanced)
```
Position Size: 12-15%
Stop Loss: 2.0%
Take Profit: 5.5%
Max Hold: 36 hours
Trailing: Active
```
### For Aggressive Trading 5-10x (High Risk)
```
Position Size: 8-12%
Stop Loss: 1.5%
Take Profit: 4.5%
Max Hold: 24 hours
ADX Filter: Disabled
```
## 📊 Performance Metrics
### Backtested Results (BTC/USDT 1H, 2 years)
- **Total Return**: ~19% (spot) / ~75% (5x leverage)*
- **Total Trades**: 240-300
- **Win Rate**: 49-52%
- **Profit Factor**: 1.25-1.50
- **Max Drawdown**: ~18-22%
- **Average Trade**: 0.5-3 days
*Leverage results exclude funding rates and real-world slippage
### Optimal Timeframes
- **1 Hour**: Best for active trading (recommended)
- **4 Hour**: More stable, fewer signals
- **15 Min**: High frequency (requires monitoring)
### Best Performing Assets
- BTC/USDT (most tested)
- ETH/USDT
- Major altcoins with good liquidity
- Not recommended for low-cap or illiquid pairs
## ⚙️ How to Use
1. **Add to Chart**: Apply strategy to 1H BTC/USDT chart
2. **Adjust Settings**: Configure risk parameters based on your preference
3. **Review Signals**: Green = Long, Red = Short, labels show signal count
4. **Monitor Performance**: Check strategy tester for detailed statistics
5. **Optimize**: Use strategy optimization to find best parameters for your market
## 🎨 Visual Indicators
The strategy provides clear visual feedback:
- **EMA Lines**: Blue (Fast), Red (Slow), Orange (Trend)
- **BUY/SELL Labels**: Show entry points with signal count
- **Stop/Target Lines**: Red (SL), Green (TP) displayed during active trades
- **Background Color**: Light green (long), light red (short) when in position
- **Info Panel**: Shows current trend, RSI, ADX, and volume status
## ⚠️ Important Notes
### Risk Disclaimer
- This strategy is for educational purposes only
- Past performance does not guarantee future results
- Cryptocurrency trading involves substantial risk
- Only trade with capital you can afford to lose
- Always use proper position sizing and risk management
### Limitations
- Performs poorly in sideways/choppy markets
- Requires sufficient liquidity for best execution
- Backtests do not include:
- Real-world slippage (especially during volatility)
- Funding rates (for perpetual futures)
- Exchange downtime or connection issues
- Emotional trading decisions
### For Futures Trading
If using this strategy on futures with leverage:
- Reduce position size proportionally to leverage
- Account for funding rates (~0.01% per 8h)
- Set max hold time to minimize funding costs
- Use lower leverage (3-5x max recommended)
- Monitor liquidation price carefully
## 🔧 Customization
All parameters are fully customizable:
- EMA periods (fast/slow/trend)
- MACD settings (12/26/9)
- RSI levels (30/70)
- Stop Loss / Take Profit percentages
- Trailing stop activation and offset
- Volume multiplier
- ADX threshold
- Maximum hold time
## 📚 Strategy Logic
The strategy follows this decision tree:
```
1. Check Trend Direction (EMA alignment)
↓
2. Scan for Entry Signals (8 types)
↓
3. Confirm with Filters (ADX, Volume, RSI)
↓
4. Enter Position with Fixed SL/TP
↓
5. Monitor for Exit Conditions:
- TP Hit → Close with profit
- SL Hit → Close with loss
- Trailing Active → Follow price
- Trend Reversal → Close position
- Max Time → Force close
```
## 🎓 Best Practices
1. **Start Conservative**: Use smaller position sizes initially
2. **Track Performance**: Monitor actual vs backtested results
3. **Optimize Regularly**: Market conditions change, adapt parameters
4. **Combine with Analysis**: Don't rely solely on automated signals
5. **Manage Emotions**: Stick to the system, avoid manual overrides
6. **Paper Trade First**: Test on demo before risking real capital
## 📞 Support & Updates
This strategy is actively maintained and updated based on:
- Market condition changes
- User feedback and suggestions
- Performance optimization
- Bug fixes and improvements
## 🏆 Conclusion
Triple EMA Multi-Signal Strategy offers a robust, systematic approach to cryptocurrency trading by combining trend following, momentum indicators, and strict risk management. Its multi-signal confirmation system helps filter false signals while the trailing stop mechanism captures extended trends.
The strategy is suitable for both manual traders looking for high-probability setups and algorithmic traders seeking a proven systematic approach.
**Remember**: No strategy wins 100% of the time. Success comes from consistent application, proper risk management, and continuous adaptation to changing market conditions.
---
*Version: 1.0*
*Last Updated: November 2025*
*Tested on: BTC/USDT, ETH/USDT (1H, 4H timeframes)*
*Recommended Capital: $5,000+ for optimal position sizing*

RC - Crypto Scalper v3Cryptocurrency scalping strategy for perpetual futures with risk management and automation capabilities.
## Strategy Overview
This strategy identifies high-probability scalping opportunities in cryptocurrency perpetual futures markets using adaptive position sizing, dynamic stop losses, and intelligent exit management to maintain consistent risk-adjusted returns across varying market conditions.
## Technical Foundation
The strategy employs exponential moving averages for trend detection, Bollinger Bands for volatility measurement and mean reversion signals, RSI for momentum confirmation and overbought/oversold conditions, ATR for dynamic volatility-based stop placement, and VWAP for institutional price level identification. These technical indicators are combined with volume analysis and optional multi-timeframe confirmation to filter low-probability setups.
## Entry Methodology
The strategy identifies trading opportunities using three complementary approaches that can be enabled individually or in combination:
Momentum-Based Entries: Detects directional price movements aligned with short-term and intermediate-term trend indicators, with momentum oscillator confirmation to avoid entries at exhaustion points. Volume analysis provides additional confirmation of institutional participation.
Mean Reversion Entries: Identifies price extremes using statistical volatility bands combined with momentum divergence, targeting high-probability reversal zones in ranging market conditions. Entries require initial price structure confirmation to reduce false signals.
Institutional Flow Entries: Monitors volume-weighted price levels to identify areas where institutional orders are likely concentrated, entering on confirmed breaks of these key levels with supporting directional bias from trend indicators.
Each methodology uses distinct combinations of the technical indicators mentioned above, with specific parameter relationships and confirmation requirements that can be customized based on trader preference and market conditions.
## Exit Framework
Adaptive Stop Loss: Uses ATR-based stops (default 0.7x multiplier on 14-period ATR) that automatically adjust to current market volatility. Stop distance expands during volatile periods to avoid premature stops while tightening during consolidation to protect capital. Alternative percentage-based stops available for traders preferring fixed-distance risk management.
Trailing Profit System: Employs a dual-target exit approach combining fixed limit orders with dynamic trailing stops. The system activates trailing stops when positions reach profitable thresholds, allowing winning trades to capture extended moves while protecting accumulated gains. The high fixed limit (6R default) serves as a ceiling for exceptional moves while the trailing mechanism handles the majority of exits at optimal profit levels.
Time-Based Management: Implements maximum holding period constraints (50 bars default) to prevent capital from being trapped in directionless price action. This ensures consistent capital turnover and prevents the strategy from holding through extended consolidation periods.
Breakeven Protection: Automatically adjusts stop loss to entry price plus commission costs once trades reach predefined profit thresholds (0.7R default), eliminating downside risk on positions that have demonstrated directional follow-through.
## Risk Management
Position Sizing: Dynamic position sizing based on account equity percentage risk model (2% default). Calculates optimal position size based on entry price, stop distance, and account risk tolerance. Includes maximum position exposure caps and minimum position size thresholds to ensure practical trade execution.
Daily Loss Limits: Automatic trading suspension when intraday losses exceed configured threshold (5% of equity default). Prevents catastrophic drawdown days and removes emotional decision-making during adverse market conditions. Resets automatically at the start of each new trading day.
Leverage Controls: Comprehensive leverage monitoring with built-in liquidation protection for margined positions. Strategy calculates liquidation prices based on leverage settings and automatically closes positions approaching critical margin levels, preventing forced liquidations.
Exposure Management: Multiple layers of position size controls including maximum position value as percentage of equity (50% default), leverage-adjusted margin requirements, and minimum capital availability thresholds before opening new positions.
## Market Filters
Session-Based Filtering: Configurable trading windows for Asian (00:00-08:00 UTC), London (08:00-16:00 UTC), and New York (13:00-21:00 UTC) sessions. Allows traders to focus on specific market hours or avoid illiquid periods based on their asset and trading style.
Volatility Requirements: Minimum and maximum ATR percentage thresholds ensure strategy only operates within optimal volatility ranges. Prevents trading during both insufficient movement periods and extreme volatility events where execution quality deteriorates.
Trend Alignment: Optional higher timeframe trend filter ensures directional bias aligns with broader market structure, reducing counter-trend entries during strong directional moves.
Volume Confirmation: Configurable volume requirements for entry validation, ensuring sufficient market participation and reducing false signals during low-liquidity periods.
## Automation Support
Built-in webhook integration generates JSON payloads compatible with popular broker automation platforms. Alert system provides comprehensive notifications for all entry signals, exit executions, risk limit breaches, and daily trading status updates. Supports both automated and manual execution workflows.
## Settings Explanation
Initial Capital: $5,000
Selected as realistic starting point for retail traders entering crypto futures markets. Strategy scales proportionally - larger accounts show similar percentage returns with proportionally larger absolute gains and position sizes.
Risk Per Trade: 2%
Conservative default providing significant drawdown tolerance. With 51% historical win rate and positive expectancy, risking 2% per trade allows for extended losing streaks without account impairment. Adjustable from 0.5% (very conservative) to 5% (aggressive, experienced traders only).
Leverage: 10x
Standard cross-margin leverage for cryptocurrency perpetual futures. Combined with 2% risk setting and maximum 50% equity position size caps, actual exposure remains controlled despite leverage. Built-in liquidation protection provides additional safety layer.
Commission: 0.055%
Modeled on major exchange maker fee structures (Bybit, Binance Futures).
**Slippage: 50 ticks**
Ultra-conservative slippage assumption representing extreme worst-case execution scenarios. ETH perpetual tick size is $0.01, therefore 50 ticks equals $0.50 per side or $1.00 round trip slippage per trade.
Real-world slippage on 30-minute timeframe typically ranges from 2-5 ticks ($0.02-0.05 round trip) under normal conditions, with 10-20 ticks during highly volatile periods. The 50-tick setting assumes every single trade executes during extreme market stress conditions.
This ultra-conservative modeling approach means real-world trading performance under typical market conditions may exceed backtest results, as the strategy has been tested under punishing execution cost assumptions that represent worst-case scenarios rather than expected outcomes.
Stop Loss: ATR-based (0.7x multiplier)
Volatility-adaptive stops optimized for 30-minute cryptocurrency perpetuals. The 0.7x multiplier balances protection against premature stops due to normal market noise. Lower multipliers (0.5-0.6x) suitable for lower timeframes, higher multipliers (0.8-1.2x) for higher timeframes.
Take Profit: 6R (Risk:Reward)
High target designed to work in conjunction with trailing stop system rather than as primary exit mechanism. Historical analysis shows most profitable trades exit via trailing stops at lower multiples, with the 6R limit capturing occasional extended moves. This configuration allows the trailing stop system to operate optimally while providing upside capture on exceptional price runs.
Trailing Stop: Activates at 1R | Offset 0.5R
Trailing mechanism engages when position reaches 1:1 risk-reward, then maintains 0.5R distance from peak favourable price. This configuration allows profitable trades room to develop while protecting accumulated gains from reversals.
Maximum Holding Period: 50 bars
Automatic exit trigger after 50 bars (25 hours on 30-minute timeframe) prevents capital commitment to non-trending price action. Adjustable based on timeframe and trading style preferences.
## Backtest Performance
Test Period: November 2023 - November 2025 (2 years)
Asset: ETH/USDT Perpetual Futures
Timeframe: 30 minutes
Initial Capital: $5,000
Performance Metrics:
- Final Equity: $25,353.99
- Net Profit: $20,353.99
- Total Return: 407.08%
- Annualized Return: ~204%
- Total Trades: 2,549
- Winning Trades: 1,308 (51.28%)
- Losing Trades: 1,241 (48.72%)
- Profit Factor: 1.215
- Sharpe Ratio: 0.813
- Sortino Ratio: 6.428
- Maximum Drawdown: 11.53%
- Average Drawdown: <2%
Trade Statistics:
- Average Win: 1.15% per trade
- Average Loss: -0.98% per trade
- Win/Loss Ratio: 1.17:1
- Largest Win: 7.14%
- Largest Loss: -2.31%
- Average Trade Duration: ~8 hours
- Trades Per Month: ~106
Cost Analysis:
- Total Commission Paid: $21,277.06
- Commission as % of Gross Profit: 18.5%
- Modeled Slippage Impact: $2,549.00 (50 ticks per trade)
- Total Trading Costs: $23,826.06
- Net Profit After All Costs: $20,353.99
Risk-Adjusted Performance:
- Return/Max DD Ratio: 35.3
- Profit Per Trade: $7.98 average
- Risk of Ruin: <0.001% (with 2% risk, 51% win rate, 1.17 R:R)
## Bear Market Validation
To validate robustness across different market conditions, the strategy was additionally tested during the 2022 cryptocurrency bear market:
Test Period: May 2022 - November 2022 (7 months)
Market Conditions: ETH declined 57% (from ~$2,900 to ~$1,200)
Bear Market Results:
- Net Profit: $4,959.69
- Return: 99.19%
- Total Trades: 845
- Win Rate: 51.72%
- Maximum Drawdown: 18.54%
- Profit Factor: 1.235
- Outperformance vs Buy & Hold: +156.3%
The strategy demonstrated profitable performance during severe market decline, with short positions showing particular strength (54.1% win rate on shorts vs 49.4% on longs). This validates that the edge is not dependent on bullish market conditions and the multiple entry methodologies adapt naturally to different market environments.
## Recommended Usage
Optimal Timeframes:
- Primary: 30-minute (tested and optimized)
- Alternative: 1-hour (more selective, fewer trades)
- Not recommended: <15-minute (execution quality deteriorates)
Suitable Assets:
High-liquidity cryptocurrency perpetual futures recommended:
- BTC/USDT (>$2B daily volume)
- ETH/USDT (>$1B daily volume)
- SOL/USDT, AVAX/USDT (>$100M daily volume)
- Avoid low-liquidity pairs (<$50M daily volume)
Risk Configuration:
- Conservative: 1-1.5% per trade
- Moderate: 2-3% per trade (default: 2%)
- Aggressive: 3-5% per trade (requires discipline)
## Important Considerations
Backtesting vs Live Trading: Always paper trade first. Real-world results vary based on execution quality, broker-specific factors, network latency, and individual trade management decisions. Backtest performance represents historical simulation with ultra-conservative cost assumptions, not guaranteed future results.
Market Conditions: Strategy designed for liquid, actively-traded markets. Performance characteristics:
- Strong trends: Optimal (trailing stops capture extended moves)
- Ranging markets: Moderate (mean reversion component provides edge)
- Low volatility: Reduced (ATR filter prevents most entries)
- Extreme volatility: Protected (maximum volatility filter prevents entries)
Cost Impact: Commission represents approximately 18.5% of gross profit in backtests. The 50-tick slippage assumption is deliberately punitive - typical execution will likely be 5-10x better (2-10 ticks actual vs 50 ticks modeled), meaning real-world net results may significantly exceed backtest performance under normal market conditions.
Execution Quality: 30-minute timeframe provides sufficient time for order placement and management. Automated execution recommended for consistency. Manual execution requires discipline to follow signals without hesitation or second-guessing.
Starting Procedures:
1. Run backtest on your specific asset and timeframe
2. Paper trade for minimum 50 trades or 2 weeks
3. Start with minimum position sizes (0.5-1% risk)
4. Gradually scale to target risk levels as confidence builds
5. Monitor actual execution costs vs backtest assumptions
## Strategy Limitations
- Requires liquid markets; performance degrades significantly on low-volume pairs
- No built-in news event calendar; traders should manually avoid scheduled high-impact events
- Weekend/holiday trading may experience wider spreads and different price behaviour
- Does not model spread costs (assumes mid-price fills); add 1-2 ticks additional cost for market orders
- Performance during market structure changes (regime shifts) may differ from backtest period
- Requires consistent monitoring during active trading hours for optimal automated execution
- Slippage assumptions are deliberately extreme; actual slippage will typically be much lower
## Risk Disclosure
Cryptocurrency trading involves substantial risk of loss. Leverage amplifies both gains and losses. This strategy will experience losing streaks and drawdowns. The 11.53% maximum historical drawdown in bull market testing and 18.54% in bear market testing do not represent ceilings - larger drawdowns are possible and should be expected in live trading.
Past performance does not guarantee future results. Market conditions evolve, and historical edge may diminish or disappear. No strategy works in all market conditions. The strategy has been tested with extremely conservative slippage assumptions (50 ticks per trade) that significantly exceed typical execution costs; this provides a safety margin but does not eliminate risk.
Capital at Risk: Only trade with capital you can afford to lose completely. The strategy's positive historical performance across both bull and bear markets does not eliminate the possibility of significant losses or account impairment.
Not Financial Advice: This strategy is an educational tool, not investment advice. Users are solely responsible for their trading decisions, risk management, and outcomes. The developer assumes no liability for trading losses.
Leverage Warning: Trading with leverage can result in losses exceeding initial investment. Ensure you understand leverage mechanics and liquidation risks before using leveraged products.
## Technical Requirements
- TradingView Premium subscription (for strategy testing and alerts)
- Understanding of risk management principles
- Familiarity with perpetual futures mechanics
- Broker account supporting crypto perpetuals (if trading live)
- For automation: Webhook-compatible execution platform
## Version History
v3.0 - November 2025 (Initial Release)
- Multi-methodology entry system (Momentum, Mean Reversion, VWAP)
- Comprehensive risk management framework
- Adaptive exit system with trailing stops
- Session and volatility filtering
- Webhook automation support
- Validated across bull market (2024-25) and bear market (2022) periods
- Tested with ultra-conservative 50-tick slippage assumptions
Disclaimer: This strategy is provided "as-is" for educational purposes. Past performance does not indicate future results. All backtests conducted with 50-tick slippage (ultra-conservative assumptions). Actual trading costs typically significantly lower. Trade responsibly and at your own risk.
